
Figures & data
Figure 1 Gefitinib-induced changes of the peripheral lymphocyte subsets: (A) CD4+ T cells, (B) CD8+ T cells, (C) NK cells, and (D) CD4+CD25+ T cells.
Abbreviation: PBMC, peripheral blood mononuclear cell.
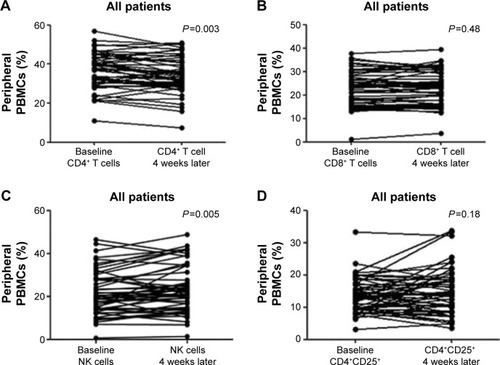
Table 1 The characteristics of enrolled NSCLC patients (n=54)
Figure 2 Gefitinib-induced decrease of circulating IL-6 and increase of INF-γ.
Abbreviations: IL, interleukin; INF-γ, interferon-γ.
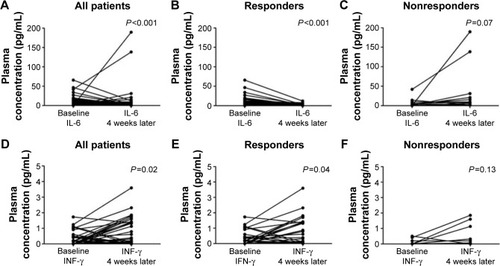
Table 2 The dynamic change of several immunological parameters and the efficacy of gefitinib
Figure 3 The prognostic value of IL-6 for PFS.
Abbreviations: CI, confidence interval; HR, hazard ratio; IL, interleukin; PFS, progression-free survival.
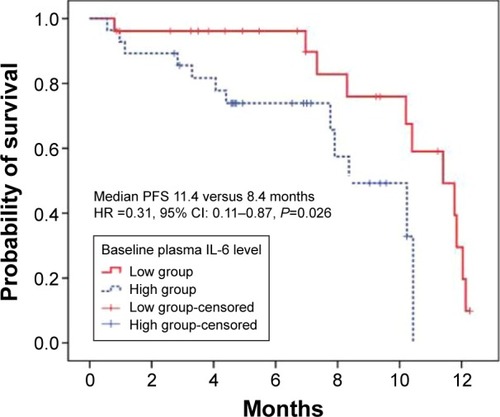
Table 3 Univariate and multivariate survival analyses of 54 NSCLC patients
Figure S1 The changes of several circulating cytokines induced by gefitinib treatment.
Note: These were analyzed for all patients (n=54) with a baseline and 4 weeks after gefitinib treatment.
Abbreviation: IL, interleukin.
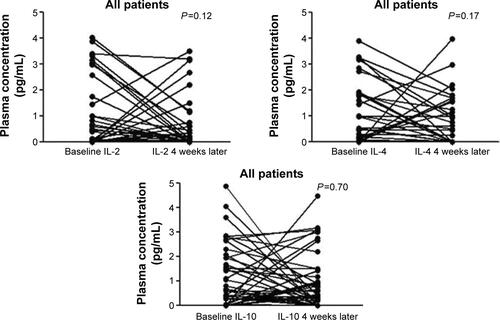
Figure S2 The prognostic value of IL-6 for progression-free survival.
Note: Higher level (≥1.7 pg/mL) versus lower level (<1.7 pg/mL) of IL-6 (A) and IL-6 reduced versus nonreduced after gefitinib treatment (B).
Abbreviation: IL, interleukin.
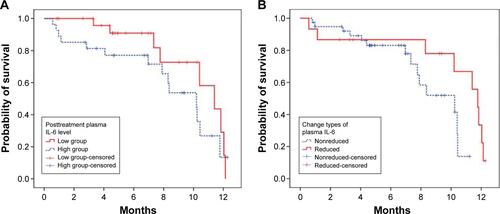
Figure S3 The expression of PD-L1 by immunohistochemical staining with a membranous pattern.
Note: Baseline staining (A) and 4 weeks after gefitinib treatment (B).
Abbreviation: PD-L1, programmed cell death ligand-1.
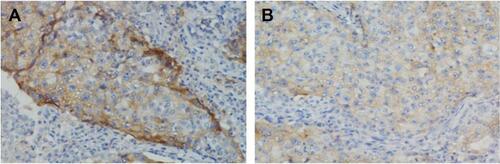
Table S1 Univariate and multivariate survival analyses involving plasma IL-6 change types
Table S2 Univariate and multivariate survival analyses involving posttreatment plasma IL-6
Table S3 The levels of peripheral lymphocytes at baseline or after 4 weeks of gefitinib treatment