Figures & data
Figure 1 Long noncoding RNA MALAT1 was specifically upregulated in ovarian cancer tissues and cell lines.
Notes: (A) MALAT1 expression was significantly higher in tumor tissues than adjacent tissues. (B) MALAT1 expression in four human ovarian cancer cell lines – SKOV3, A2780, HO8910, and CAOV3 – was upregulated compared to normal human ovarian surface epithelial cells (HOSEPiCs). Data presented as mean ± standard deviation of three independent experiments. *P<0.05; **P<0.01.
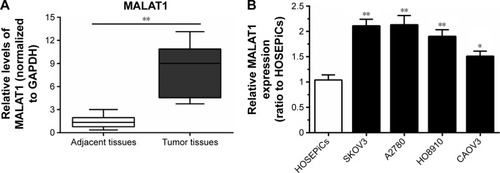
Figure 2 MALAT1 promoted ovarian cancer-cell growth.
Notes: (A) MALAT1 knockdown was achieved by si-MALAT1 and the inhibitory efficiency was verified by real-time PCR. (B, C) MTT assays revealed that knockdown of MALAT1 significantly attenuated the proliferation of both SKOV3 and A2780 cell lines over time, compared with the si-NC group. (D, E) Bromodeoxyuridine assays revealed that knockdown of MALAT1 markedly reduced DNA synthesis of both SKOV3 and A2780 cell lines. Data presented as mean ± standard deviation of three independent experiments. **P<0.01.
Abbreviations: si, small interfering; PCR, polymerase chain reaction; NC, negative control; OD, optical density.
Abbreviations: si, small interfering; PCR, polymerase chain reaction; NC, negative control; OD, optical density.
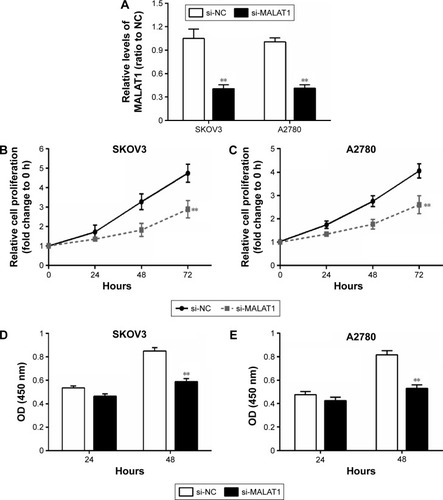
Figure 3 miR-506 expression was downregulated in ovarian cancer tissues and negatively correlated with lncRNA-MALAT1.
Notes: (A) Real-time PCR assay showed that expression levels of miR-506 were significantly upregulated after knockdown of MALAT1 compared with the si-NC group. (B) miR-506 mimics were used to achieve miR-506 overexpression, and expression levels of miR-506 were verified by real-time PCR in SKOV3 and A2780 cell lines. (C) Expression levels of MALAT1 were determined by real-time PCR in response to miR-506 overexpression. Results showed that MALAT1 expression was decreased in response to miR-506 overexpression, compared with the miR-506 NC group. (D) Expression levels of miR-506 were significantly downregulated in tumor tissues compared with adjacent normal tissues. (E) An inverse correlation between MALAT1 and miR-506 expressions was observed. Data presented as mean ± standard deviation of three independent experiments. **P<0.01.
Abbreviations: miR, microRNA; lncRNA, long noncoding RNA; PCR, polymerase chain reaction; si, small interfering; NC, negative control.
Abbreviations: miR, microRNA; lncRNA, long noncoding RNA; PCR, polymerase chain reaction; si, small interfering; NC, negative control.
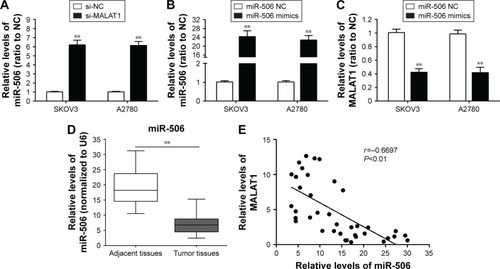
Figure 4 MALAT1 regulated miR-506 by direct targeting.
Notes: (A) A wt-MALAT1 3′-UTR luciferase-reporter vector (wt-MALAT1) and mut-MALAT1 3′-UTR luciferase-reporter vectors (mut-MALAT1) were constructed by sequentially mutating the two predicted two miR-506-binding sites in the MALAT1 3′-UTR. (B) The wt-MALAT1/mut-MALAT1 vectors and miR-506 NC/miR-506 mimics were cotransfected into SKOV3 cells. Luciferase activity of the MALAT1 3′-UTR luciferase-reporter vector was significantly reduced in miR-506 mimic-transfected cells compared to control groups. miR-506-mediated repression of MALAT1 3′-UTR luciferase-reporter activity was abolished by mutation of the putative miR-506-binding site in the MALAT1 3′-UTR. Data presented as mean ± standard deviation of three independent experiments. **P<0.01.
Abbreviations: miR, microRNA; wt, wild type; UTR, untranslated region; mut, mutant; NC, negative control.
Abbreviations: miR, microRNA; wt, wild type; UTR, untranslated region; mut, mutant; NC, negative control.
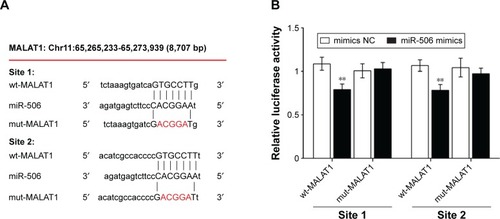
Figure 5 miR-506 inhibited ovarian cancer-cell growth.
Notes: (A, B) Cell proliferation in both the SKOV3 and A2780 cell lines was reduced in response to miR-506 overexpression compared with the miR-506 NC group. (C, D) Results from bromodeoxyuridine assays indicated that miR-506 overexpression markedly reduced DNA synthesis of both SKOV3 and A2780 cell lines compared with the miR-506 NC group. Data presented as mean ± standard deviation of three independent experiments. **P<0.01.
Abbreviations: miR, microRNA; NC, negative control; OD, optical density.
Abbreviations: miR, microRNA; NC, negative control; OD, optical density.
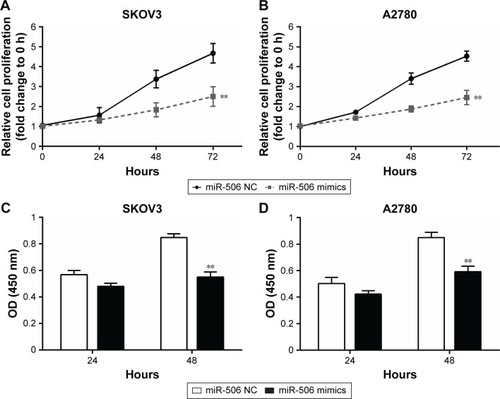
Figure 6 miR-506 regulated iASPP expression by direct targeting.
Notes: (A) A wt-iASPP 3′-UTR luciferase-reporter vector (wt-iASPP) and a mut-iASPP 3′-UTR luciferase reporter vector (mut-iASPP) were created by sequentially mutating the predicted two miR-506-binding sites in the iASPP 3′-UTR. The wt-iASPP/mut-iASPP vectors and miR-506 NC/miR-506 mimics were cotransfected into SKOV3 cells. The luciferase activity of the iASPP 3′-UTR luciferase-reporter vector was significantly reduced in miR-506 mimic-transfected cells compared to control groups. miR-506-mediated repression of iASPP 3′-UTR luciferase-reporter activity was abolished by mutation of the putative miR-506-binding site in the iASPP 3′-UTR. (B) Western blot assay showed that the expression of iASPP was significantly downregulated by miR-506 overexpression in both SKOV3 and A2780 cell lines. (C) Expression levels of iASPP were significantly upregulated in tumor tissues compared with adjacent normal tissues. (D) An inverse correlation between iASPP and miR-506 expressions was observed. Data presented as mean ± standard deviation of three independent experiments. **P<0.01.
Abbreviations: miR, microRNA; wt, wild type; UTR, untranslated region; mut, mutant; NC, negative control.
Abbreviations: miR, microRNA; wt, wild type; UTR, untranslated region; mut, mutant; NC, negative control.
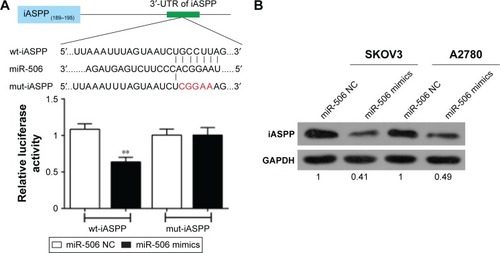
Figure 7 MALAT1 was positively correlated with iASPP.
Notes: (A) A positive correlation between MALAT1 and iASPP levels was observed. (B, C) Western blot results showed that protein contents of iASPP in SKOV3 and A2780 cell lines were significantly decreased in response to MALAT1 knockdown by si-MALAT1 or iASPP inhibition by si-iASPP. Data presented as mean ± standard deviation of three independent experiments.
Abbreviations: si, small interfering; NC, negative control.
Abbreviations: si, small interfering; NC, negative control.
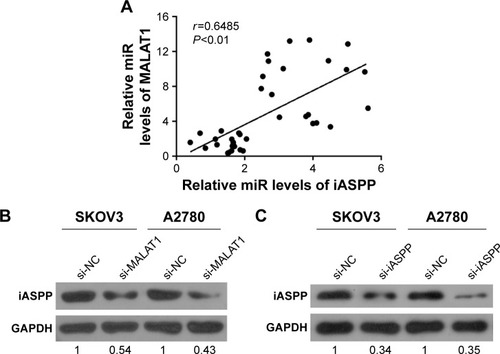
Figure 8 iASPP promoted ovarian cancer-cell growth.
Notes: (A, B) MTT-assay results showed that ovarian cancer-cell growth was attenuated in response to iASPP inhibition by si-iASPP. (C, D) Transwell results showed that cell-migratory capacities were reduced after iASPP inhibition. Data presented as mean ± standard deviation of three independent experiments. **P<0.01.
Abbreviations: si, small interfering; NC, negative control; OD, optical density.
Abbreviations: si, small interfering; NC, negative control; OD, optical density.
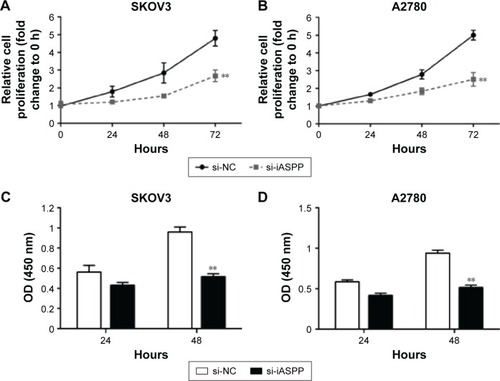
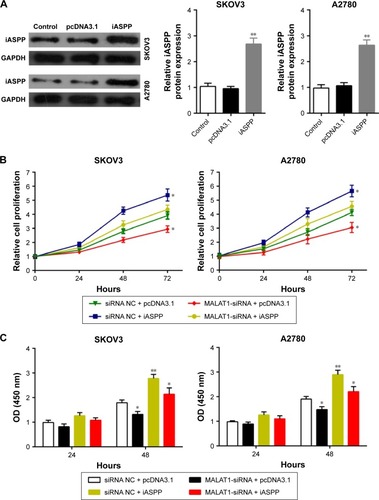
Figure 9 MALAT1 regulated ovarian cancer cell growth through iASPP.
Notes: (A) Transfection of pcDNA3.1/iASPP into SKOV3 and A2780 cell lines was generated to achieve iASPP overexpression. Transfection efficiency was verified using Western blot assay. (B) MTT assay was generated to determine the growth of SKOV3 and A2780 cell lines in response to cotransfection of si-NC/si-MALAT1 and pcDNA3.1/iASPP. (C) Bromodeoxyuridine assay was generated to determine the DNA synthesis of SKOV3 and A2780 cell lines in response to cotransfection of si-NC/si-MALAT1 and pcDNA3.1/iASPP. Data presented as mean ± standard deviation of three independent experiments. *P<0.05; **P<0.01.
Abbreviations: pcDNA, plasmid complementary DNA; si, small interfering; NC, negative control; OD, optical density.
Abbreviations: pcDNA, plasmid complementary DNA; si, small interfering; NC, negative control; OD, optical density.