Figures & data
Table 1 Clinicopathological features of 118 patients with hepatocellular carcinoma
Table 2 The primers for quantitative real-time polymerase chase reaction
Figure 1 The protein and mRNA expressions of HGF and c-Met expressions in the HCC and adjacent normal tissues (×200). (A) The protein expressions of HGF and c-Met in HCC and adjacent normal tissues; (B) the HGF mRNA expressions in HCC and adjacent normal tissues; (C) the c-Met mRNA expressions in HCC and adjacent normal tissues; *P<0.05 compared with the adjacent normal tissues.
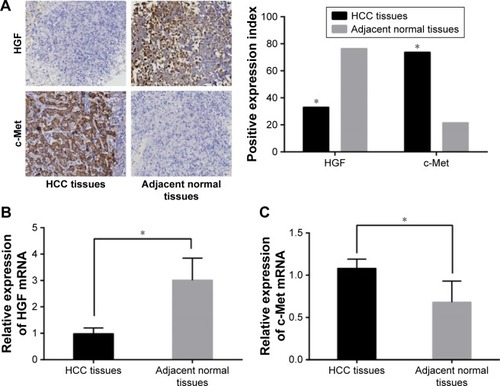
Figure 2 Comparison of microvessel density in the HCC and adjacent normal tissues. (A) The CD34 expression in HCC tissues and adjacent normal tissues (×400); (B) Comparison of MVD in the HCC and adjacent normal tissues; **P<0.01 compared with the adjacent normal tissues.
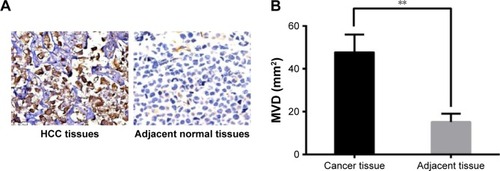
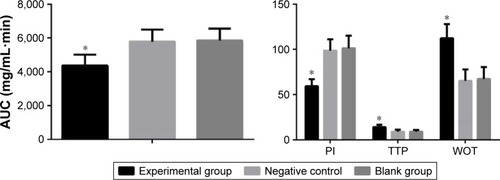
Table 3 Comparisons of quantitative parameters of CEUS between liver parenchyma and HCC lesions
Table 4 Correlations of HGF and c-Met protein expressions and MVD with clinicopathological features of HCC patients
Table 5 Correlations of quantitative parameters of CEUS with clinicopathological features of HCC patients
Table 6 Univariate survival analysis of risk factors for the prognosis of HCC patients
Table 7 Multivariate survival analysis with Cox’s proportional hazards model of risk factors for the prognosis of HCC patients
Figure 3 Effects of c-Met inhibitor on the growth of transplanted tumors in nude mice. (A) The growth of transplanted tumors in nude mice of three groups; (B) comparison of weights of transplanted tumors in nude mice of three groups; *P<0.05 compared with blank group.
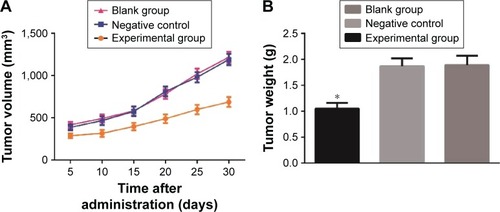
Figure 4 Effects of c-Met inhibitor on MVD of transplanted tumors in nude mice. (A) The MVD of transplanted tumors in nude mice of the experimental group, ×400; (B) the MVD of transplanted tumors in nude mice of the negative control group, ×400; (C) the MVD of transplanted tumors in nude mice of the blank group, ×400; (D) comparison of MVD among three groups; *P<0.05 compared with blank group.
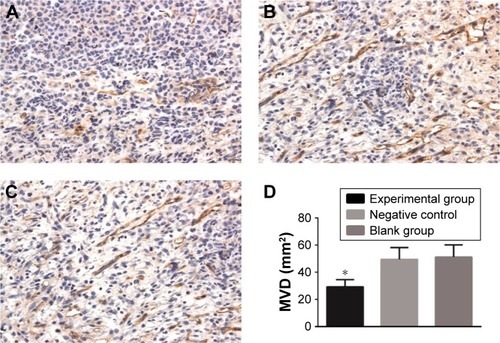
Figure 5 Comparisons of quantitative parameters of CEUS of transplanted tumors in nude mice among three groups. *P<0.05 compared with blank group.