59
Views
7
CrossRef citations to date
0
Altmetric
Original Research

Influence of MDM2 polymorphisms on squamous cell carcinoma susceptibility: a meta-analysis

, , &
Pages 6211-6224 | Published online: 11 Oct 2016

Figures & data

Figure 1 Flow diagram of article-search strategy for meta-analysis.

Abbreviation: SCC, squamous cell carcinoma.
Figure 1 Flow diagram of article-search strategy for meta-analysis.

Table 1 Characteristics of studies included for meta-analysis

Figure 2 Meta-analysis of the association between MDM2 rs2279744 and SCC susceptibility under the G vs T model.

Notes: (A) Forest plot; (B) Egger’s funnel plot of publication-bias; (C) sensitivity analysis. Weights are from random-effect analysis.
Abbreviations: SCC, squamous cell carcinoma; OR, odds ratio; CI, confidence interval.
Figure 2 Meta-analysis of the association between MDM2 rs2279744 and SCC susceptibility under the G vs T model.

Figure 3 Meta-analysis of the association between MDM2 rs2279744 and SCC susceptibility under the GG vs TT model.

Notes: (A) Forest plot; (B) Egger’s funnel plot of publication-bias; (C) sensitivity analysis. Weights are from random-effect analysis.
Abbreviations: SCC, squamous cell carcinoma; OR, odds ratio; CI, confidence interval.
Figure 3 Meta-analysis of the association between MDM2 rs2279744 and SCC susceptibility under the GG vs TT model.

Figure 4 Meta-analysis of the association between MDM2 rs2279744 and SCC susceptibility under the TG vs TT model.

Notes: (A) Forest plot; (B) Egger’s funnel plot of publication-bias; (C) sensitivity analysis. Weights are from random-effect analysis.
Abbreviations: SCC, squamous cell carcinoma; OR, odds ratio; CI, confidence interval.
Figure 4 Meta-analysis of the association between MDM2 rs2279744 and SCC susceptibility under the TG vs TT model.

Figure 5 Meta-analysis of the association between MDM2 rs2279744 and SCC susceptibility under the TG + GG vs TT model.

Notes: (A) Forest plot; (B) Egger’s funnel plot of publication-bias; (C) sensitivity analysis. Weights are from random-effect analysis.
Abbreviations: SCC, squamous cell carcinoma; OR, odds ratio; CI, confidence interval.
Figure 5 Meta-analysis of the association between MDM2 rs2279744 and SCC susceptibility under the TG + GG vs TT model.

Figure 6 Meta-analysis of the association between MDM2 rs2279744 and SCC susceptibility under the GG vs TT + TG model.

Notes: (A) Forest plot; (B) Egger’s funnel plot of publication-bias; (C) sensitivity analysis. Weights are from random-effect analysis.
Abbreviations: SCC, squamous cell carcinoma; OR, odds ratio; CI, confidence interval.
Figure 6 Meta-analysis of the association between MDM2 rs2279744 and SCC susceptibility under the GG vs TT + TG model.

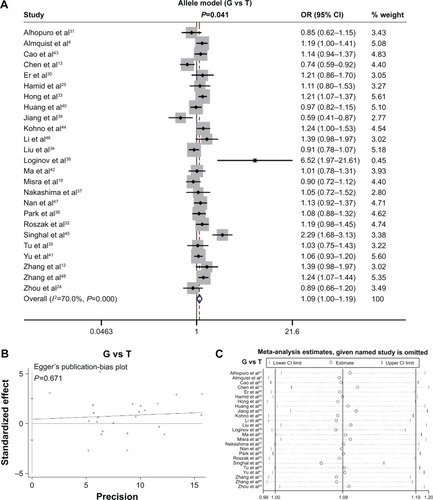
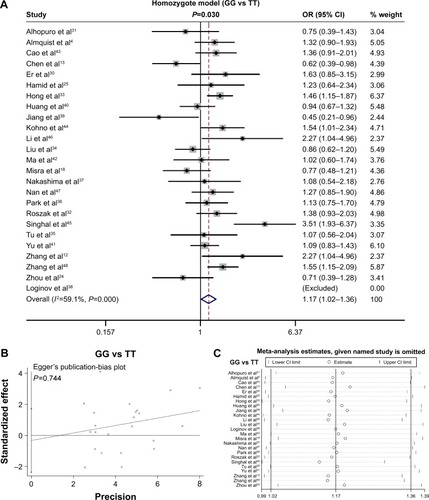
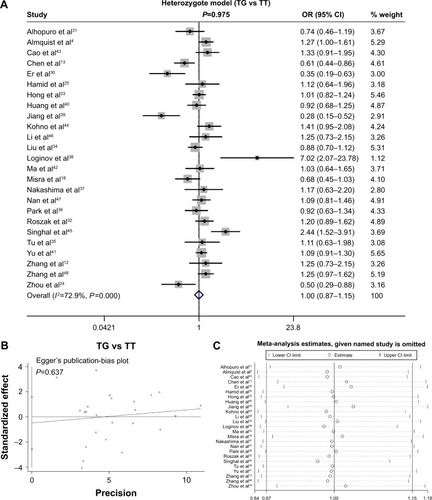
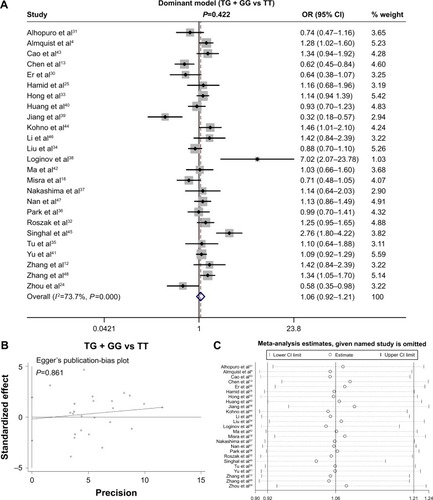
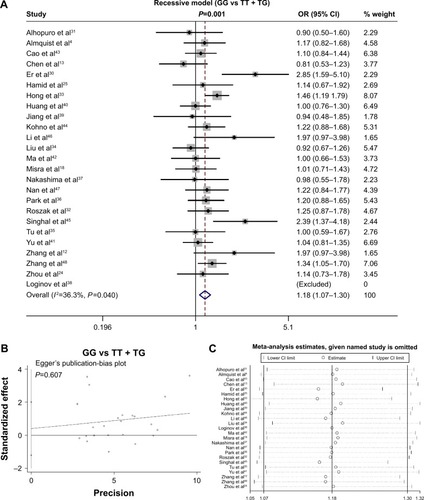
Table 2 Meta analysis of the association between MDM2 polymorphisms (rs2279744, rs937283, and rs3730485) and SCC susceptibility

Table 3 Subgroup analysis by ethnicity, source of controls, and HWE for association between MDM2 rs2279744 and SCC susceptibility

Table 4 Subgroup analysis by disease type for association between MDM2 rs2279744 and SCC susceptibility

Table 5 Meta-analysis of association between MDM2ITP53 mutations and SCC susceptibility