Figures & data
Table 1 Correlations between serum miR-503 expression levels and clinical parameters
Figure 1 MiR-503 downregulation in GC tissues.
Notes: (A) The expression level of miR-503 in GC and adjacent normal mucosal tissues (n=68) was determined by RT-qPCR analysis. (B) MiR-503 expression levels in metastatic (n=54) and nonmetastatic (n=14) GC.
Abbreviations: GC, gastric cancer; RT-qPCR, real-time reverse transcription quantitative polymerase chain reaction.
Abbreviations: GC, gastric cancer; RT-qPCR, real-time reverse transcription quantitative polymerase chain reaction.
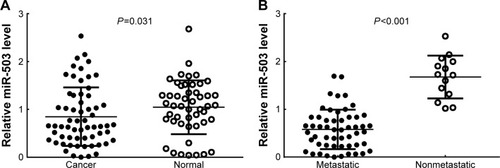
Figure 2 Diagnostic and prognostic significance of miR-503 in tissues of GC.
Notes: (A) ROC curve analysis showing performance of miR-503 expression to discriminate between malignant and nonmalignant tissue samples. (B) Kaplan–Meier analysis and log-rank test for overall survival of GC patients based on miR-503 expression.
Abbreviations: GC, gastric cancer; ROC, receiver operating characteristic; AUC, area under the curve; CI, confidence interval.
Abbreviations: GC, gastric cancer; ROC, receiver operating characteristic; AUC, area under the curve; CI, confidence interval.
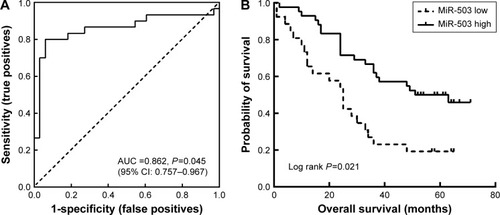
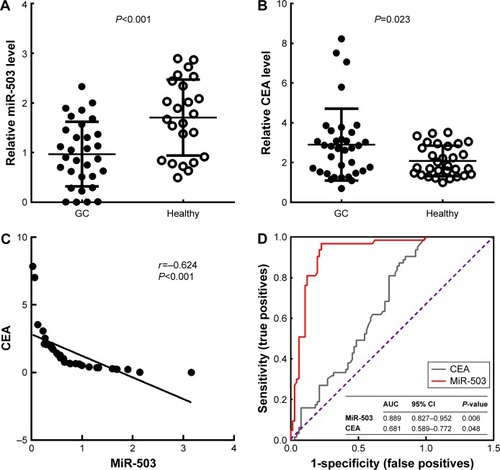
Figure 3 MiR-503 expression and diagnostic significance in serum of GC patients and healthy controls.
Notes: (A) The expression level of miR-503 in serum of GC patients (n=32) or healthy participants (n=32) was determined by RT-qPCR analysis. (B) The expression level of CEA in serum of GC patients (n=32) or healthy participants (n=32) was determined by RT-qPCR analysis. (C). Correlation of the expression of miR-503 and CEA in GC patients. (D) ROC analysis curve of CEA and miR-503 expression in the serum of the GC patients and healthy controls.
Abbreviations: GC, gastric cancer; RT-qPCR, real-time reverse transcription quantitative polymerase chain reaction; CEA, carcinoembryonic antigen; ROC, receiver operating characteristic; AUC, area under the curve; CI, confidence interval.
Abbreviations: GC, gastric cancer; RT-qPCR, real-time reverse transcription quantitative polymerase chain reaction; CEA, carcinoembryonic antigen; ROC, receiver operating characteristic; AUC, area under the curve; CI, confidence interval.