
Figures & data
Figure 1 The computed tomography morphological features of patients with stage I non-small cell lung cancer.
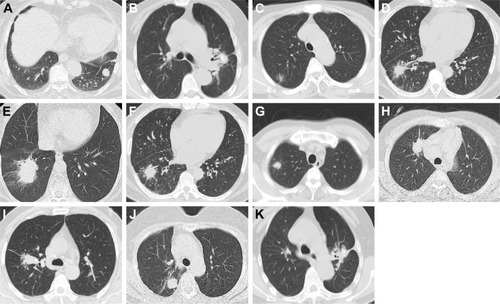
Figure 2 Survival curve of stage I non-small cell lung cancer patients with different tumor node metastasis stages.
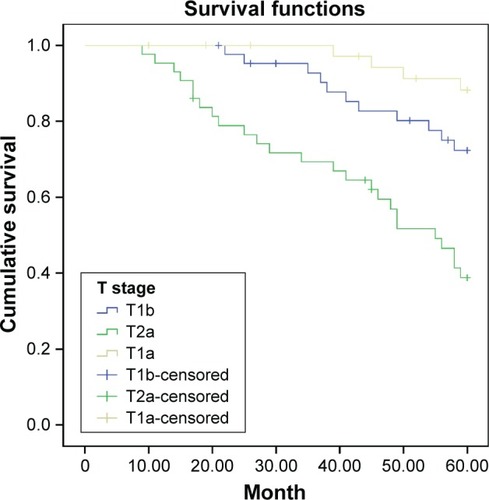
Table 1 The relationships of CT morphological features with 5-year survival rates of patients with stage I non-small cell lung cancer
Figure 3 Survival curve of stage I non-small cell lung cancer patients with different computed tomography features of tumor density.
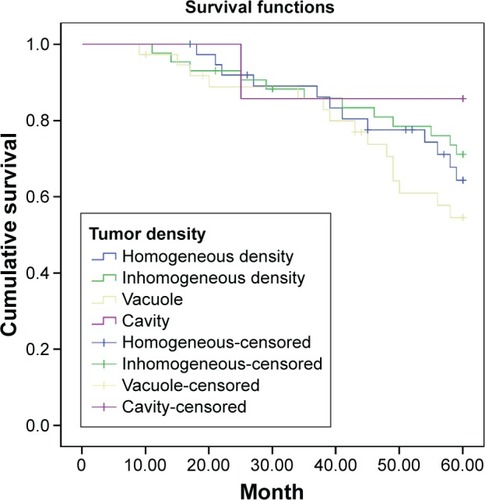
Figure 4 Survival curve of stage I non-small cell lung cancer patients with different computed tomography features of tumor margin.
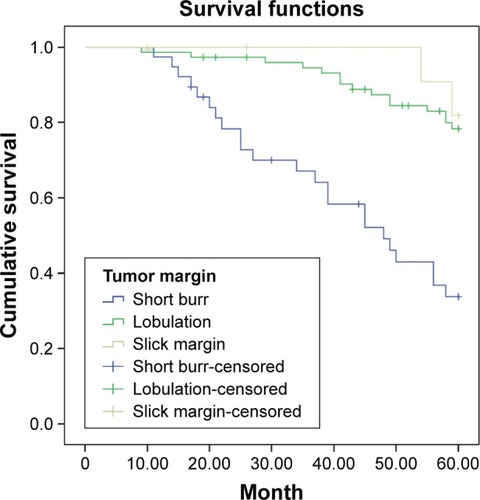
Figure 5 Survival curve of stage I non-small cell lung cancer patients with different computed tomography features of tumor periphery.
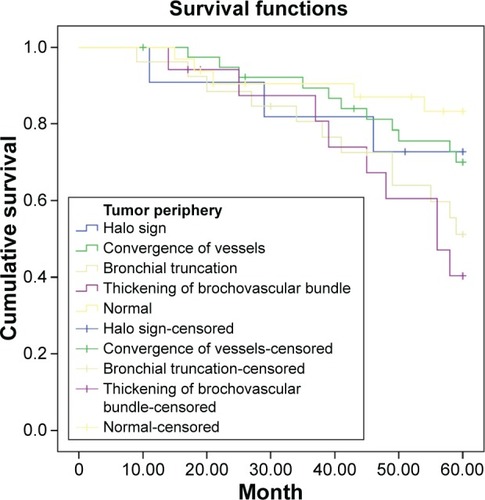
Figure 6 Survival curve of stage I non-small cell lung cancer patients with different computed tomography features of pleural invasion.
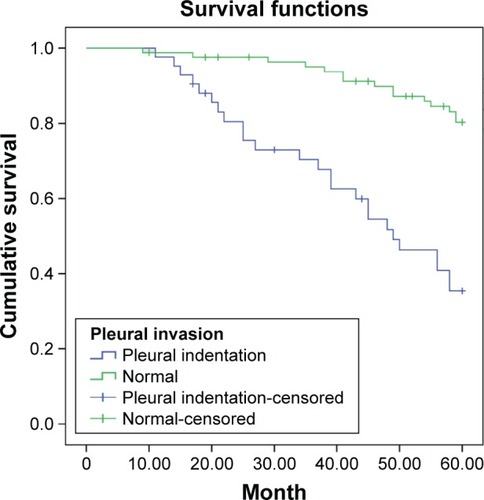
Table 2 Cox regression analysis of prognostic factors for stage I non-small cell lung cancer