Figures & data
Figure 1 Bone marrow examination showing infiltrate with cells of lymphoid morphology, intact (arrows), or smudged.
Note: No azurophilic granules are observed (bone marrow – May-Grunwald–Giemsa stain, ×100 magnification).
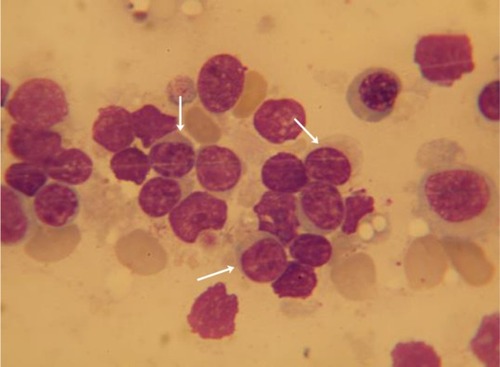
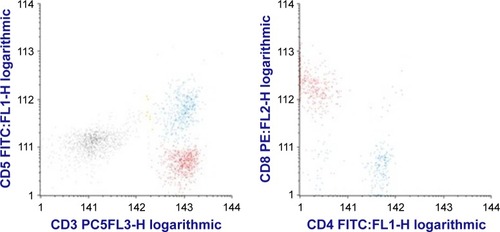
Figure 2 Dot plot histograms showing atypical suppressor CD5−CD3+CD8+ T cells (in red) and normal CD3+CD5+ T-cells (blue).
Notes: FACSCalibur acquisition with CellQuest acquisition software of bone marrow aspirate leukocytes marked with a monoclonal antibody panel including CD3 PC5, CD4 FITC, CD5 FITC, and CD8 PE. Infinicyt 7.0 software was used for analysis.