Figures & data
Figure 1 The expression of NEAT1 is upregulated in HCC tissues and cell lines.
Abbreviations: ANOVA, analysis of variance; HCC, hepatocellular carcinoma; GAPDH, lyceraldehyde 3-phosphate dehydrogenase; NEAT1, nuclear-enriched abundant transcript 1.
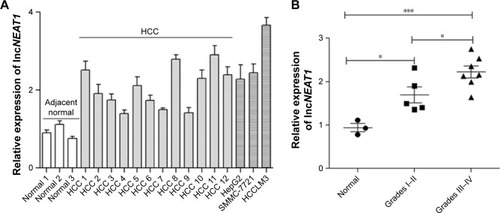
Figure 2 Knocking down NEAT1 inhibited the proliferation of the hepatocellular carcinoma cell lines HepG2 and SMMC-7721.
Abbreviations: ANOVA, analysis of variance; CCK-8, cell counting kit-8; CFSE, cell tracer: carboxyfluorescein diacetate, succinimidyl ester; GAPDH, lyceraldehyde 3-phosphate dehydrogenase; hnRNP A2, heterogeneous nuclear ribonucleoprotein A2; NC, normal control; NEAT1, nuclear-enriched abundant transcript 1; OD, optical density; SD, standard deviation; si, small intefering.
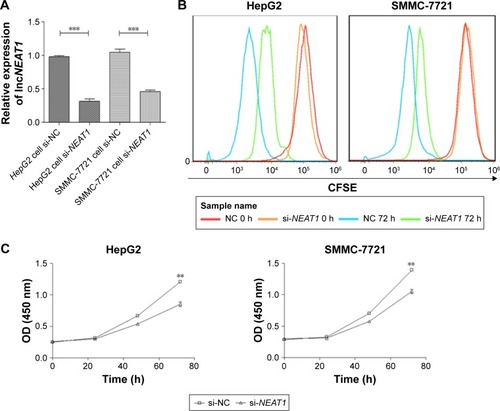
Figure 3 Knocking down NEAT1 inhibited the migration and invasion of the hepatocellular carcinoma cell lines HepG2 and SMMC-7721.
Abbreviations: DMEM, Dulbecco’s Modified Eagle’s Medium; hnRNP A2, heterogeneous nuclear ribonucleoprotein A2; NC, normal control; NEAT1, nuclear-enriched abundant transcript 1; SD, standard deviation; si, small intefering.
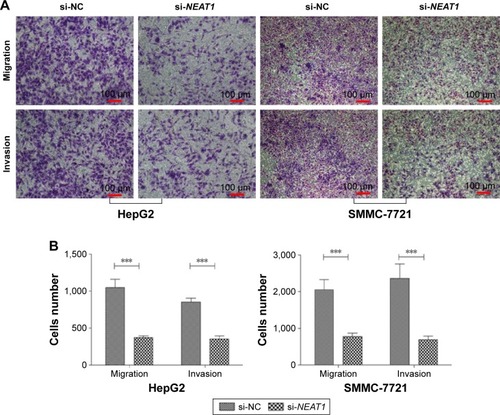
Figure 4 Knockdown of NEAT1 altered global gene expression patterns in HCC cells.
Abbreviations: CCR; C chemokine receptor; GO, gene ontology; HCC, hepatocellular carcinoma; hnRNP A2, heterogeneous nuclear ribonucleoprotein A2; KEGG, Kyoto Encyclopedia of Genes and Genomes; NC, normal control; NEAT1, nuclear-enriched abundant transcript 1; NTP, nucleoside triphosphate; si, small interfering.
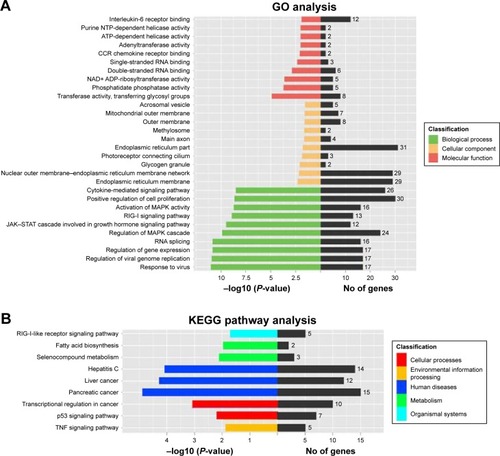
Figure 5 Knockdown of NEAT1-regulated genes which were related with HCC progression.
Abbreviations: GAPDH, lyceraldehyde 3-phosphate dehydrogenase; HCC, hepatocellular carcinoma; hnRNP A2, heterogeneous nuclear ribonucleoprotein A2; NEAT1, nuclear-enriched abundant transcript 1; si, small interfering.
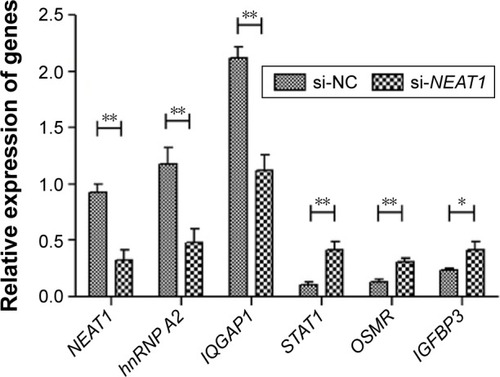
Table 1 Selected transcriptional changes
Figure 6 U2AF65 binds to NEAT1 and mRNA hnRNP A2.
Abbreviations: CCD, charge coupled device; GAPDH, lyceraldehyde 3-phosphate dehydrogenase; hnRNP A2, heterogeneous nuclear ribonucleoprotein A2; IgG, immuglobulin G; NEAT1, nuclear-enriched abundant transcript 1; RIP, RNA immunoprecipitation; RT-qPCR, reverse transcription quantitative polymerase chain reaction; SDS, sodium dodecyl sulfate; U2AF65, U2 small nuclear RNA auxiliary factor 2.
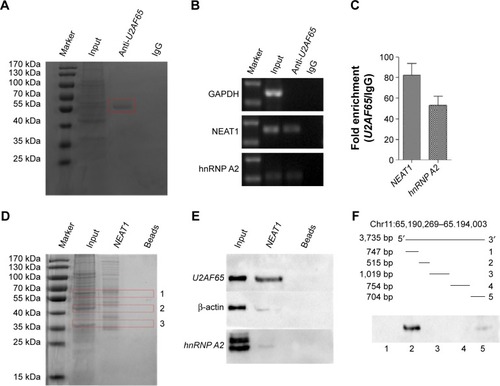
Figure 7 Knocking down NEAT1 and U2AF65 downregulated hnRNP A2 expression.
Abbreviations: CCD, charge coupled device; DAB, diaminobenzidine; EMSA, electrophoretic mobility shift assay; hnRNP A2, heterogeneous nuclear ribonucleoprotein A2; HRP, horseradish peroxidase; mRNA, messenger RNA; NC, normal control; NEAT1, nuclear-enriched abundant transcript 1; si, small interfering; U2AF65, U2 small nuclear RNA auxiliary factor 2.
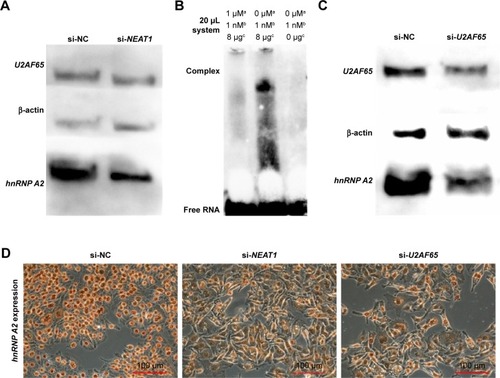
Figure 8 The overexpression of hnRNP A2 rescued the proliferation and invasion of HCC cells expressing low levels of lncRNA-NEAT1.
Abbreviations: ANOVA, analysis of variance; CCK-8, cell counting kit-8; DMEM, Dulbecco’s Modified Eagle’s Medium; HCC, hepatocellular carcinoma; hnRNP A2, heterogeneous nuclear ribonucleoprotein A2; lncRNA, long noncoding RNAs; NC, normal control; NEAT1, nuclear-enriched abundant transcript 1; OD, optical density; si, small interfering.
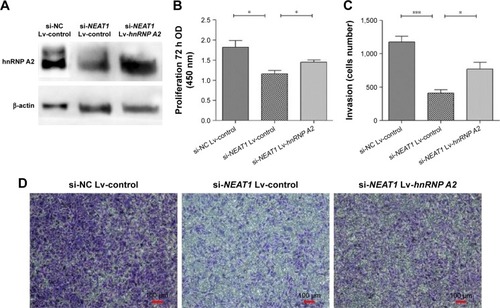
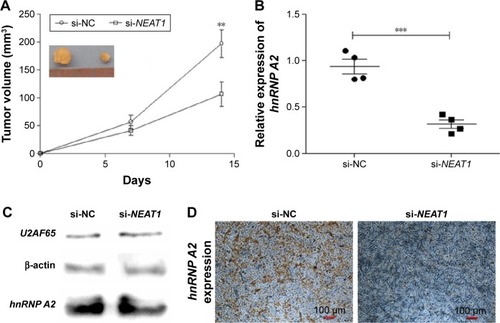
Figure 9 Knocking down NEAT1 inhibited HepG2 cell growth and downregulated hnRNP A2 expression in vivo.
Abbreviations: GAPDH, lyceraldehyde 3-phosphate dehydrogenase; hnRNP A2, heterogeneous nuclear ribonucleoprotein A2; IHC, immunohistochemistry; NC, normal control; NEAT1, nuclear-enriched abundant transcript 1; si, small interfering; U2AF65, U2 small nuclear RNA auxiliary factor 2.