Figures & data
Figure 1 Conventional MRI and 1H-MRS images of a typical glioblastoma.
Notes: (A) An isointense/hypointense lesion visible on axial T1-WI. (B) T2-WI and (C) T2-FLAIR showed a hyperintense mass with remarkable infiltration. (D) Contrast-enhanced image demonstrated clear enhancement of the tumor. (E) Cho/Cr spectra from multiple-voxel regions inside the tumor. (F) Differences in Cho/Cr ratios between high and low metabolic regions in combined high-grade gliomas and grade III and grade IV gliomas separately; all were highly significantly different (P<0.01).
Abbreviations: MRI, magnetic resonance imaging; 1H-MRS, proton magnetic resonance spectroscopy; WI, weighted image; T2-FLAIR, T2-weighted fluid-attenuated inversion recovery; Cho, choline; Cr, creatine.
Abbreviations: MRI, magnetic resonance imaging; 1H-MRS, proton magnetic resonance spectroscopy; WI, weighted image; T2-FLAIR, T2-weighted fluid-attenuated inversion recovery; Cho, choline; Cr, creatine.
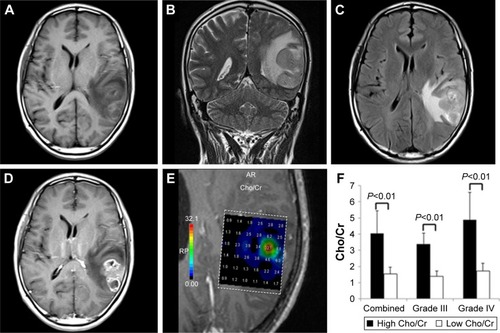
Figure 2 Neuronavigational system-guided stereotactic biopsy and tumor resection.
Notes: (A) Coronal, (B) sagittal, and (C) axial sections of the tumor. (D) 3D rendition of the patient.
Abbreviation: 3D, three-dimensional.
Abbreviation: 3D, three-dimensional.
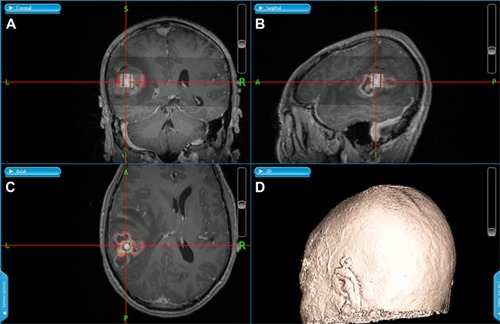
Figure 3 Neurospheres formed from glioma tissues with distinct Cho/Cr metabolic activities.
Notes: (A) Neurospheres formed from low Cho/Cr ratio tissues were fewer and smaller in size. (B) Neurospheres formed from high Cho/Cr ratio regions grew more quickly and were more numerous. (C) There was a highly significant difference between the mean numbers of neurospheres formed from distinct regions within same gliomas (P<0.001). Red arrows show the neurospheres cultured from high-grade glioma samples.
Abbreviations: Cho, choline; Cr, creatine.
Abbreviations: Cho, choline; Cr, creatine.
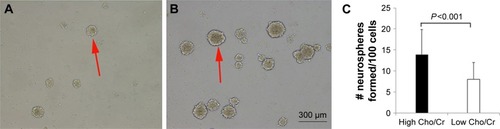
Figure 4 Cancer stem-like cells within gliomas varied in number in distinct regions of gliomas.
Notes: Tissues with high Cho/Cr ratios, stained with the stem cell markers, (A) CD133, (C) nestin, and (E) CD15. Tissues with low Cho/Cr ratios, stained with the stem cell markers, (B) CD133, (D) nestin, and (F) CD15. (G) There were highly significant differences in the percentage of CD133+, nestin+, and CD15+ cells between high and low Cho metabolic regions. Red arrows show the CD133+, nestin+, or CD15+ cells in high-grade glioma samples. Magnification, 100×. Scale bar, 200 μm.
Abbreviations: Cho, choline; Cr, creatine.
Abbreviations: Cho, choline; Cr, creatine.
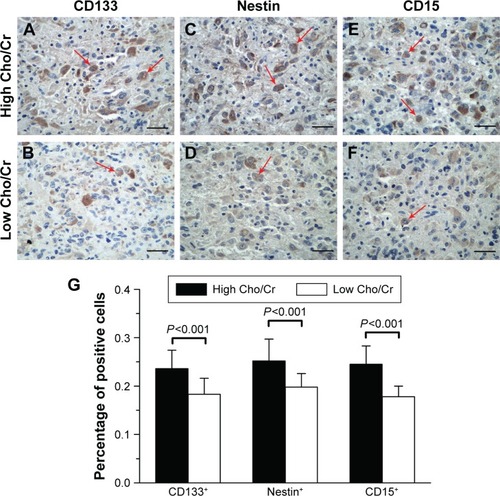
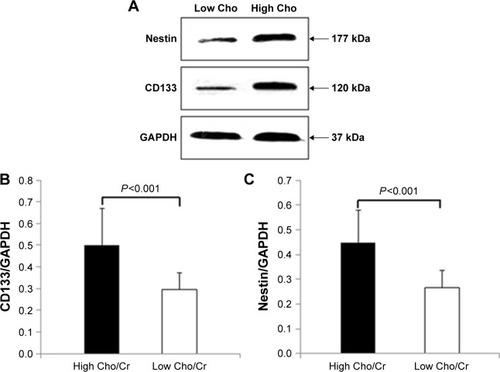
Figure 5 Expression of CD133 and nestin correlated with Cho/Cr ratios in gliomas.
Notes: (A) Western blot incubated with nestin and CD133 antibodies showed stronger expression of stem cell markers in high Cho/Cr ratio regions than those in low Cho/Cr ratio regions. There were highly significant differences in (B) CD133 and (C) nestin expression levels between high and low Cho/Cr ratio regions.
Abbreviations: Cho, choline; Cr, creatine.
Abbreviations: Cho, choline; Cr, creatine.