Figures & data
Table 1 Primer sequences
Table 2 Demographic and clinical characteristics of patients with CLL (n=58)
Figure 1 Global histone H3/H4 acetylation and H3K9 methylation in subjects.
Notes: The global histone H3/H4 hypoacetylation in the CD19+ B cells of patients with CLL compared with controls (A and B) (P=0.028 and P=0.03, respectively). No significant difference in the global histone H3K4 methylation between the two groups (C). The global histone H3K9 methylation in patients with CLL was significantly higher than that of healthy controls (D) (P=0.02). The bars are presented as mean ± SD; OD units at 450 nm.
Abbreviations: CLL, chronic lymphocytic leukemia; OD, optical density; SD, standard deviation.
Abbreviations: CLL, chronic lymphocytic leukemia; OD, optical density; SD, standard deviation.
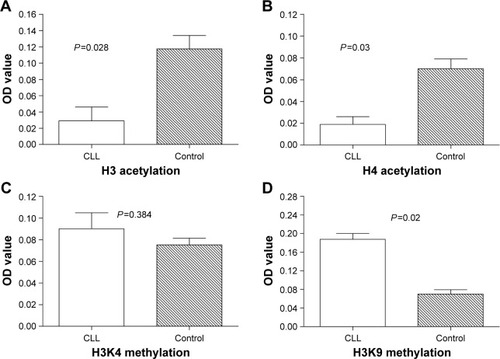
Figure 2 The SIRT1 mRNA expression in subjects.
Notes: The expression level of SIRT1 mRNA in patients with CLL was significantly higher than that of healthy controls (P=0.03) (A). The level of SIRT1 mRNA expression increased significantly with progression from Binet stage A to stage C (P=0.015) (B) and Rai good to high risk stage (P=0.007) (C). The bars indicate the relative mRNA levels of SIRT1 (mean ± SD).
Abbreviations: CLL, chronic lymphocytic leukemia; SD, standard deviation.
Abbreviations: CLL, chronic lymphocytic leukemia; SD, standard deviation.
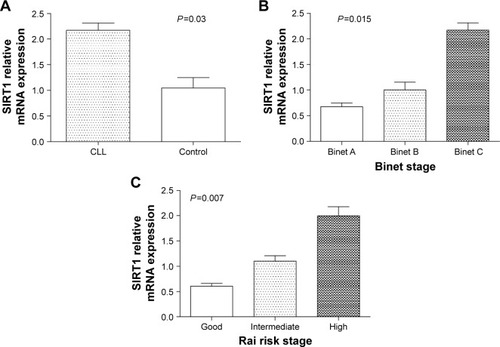
Figure 3 The EZH2 mRNA expression in subjects.
Notes: The expression level of EZH2 mRNA in patients with CLL was significantly higher than that of healthy controls (P=0.02) (A). The level of EZH2 mRNA expression increased significantly with progression from Binet stage A to stage C (P=0.01) (B) and Rai good to high risk stage (P=0.008) (C). The level of EZH2 mRNA expression increased significantly in the β2-MG+ subgroup compared with that in the β2-MG− subgroup (P=0.029) (D). The bars indicate the relative mRNA levels of SIRT1 (mean ± SD). β2-MG+, defined as β2-MG >3.5 mg/L; β2-MG−, defined as β2-MG ≤3.5 mg/L.
Abbreviations: CLL, chronic lymphocytic leukemia; β2-MG, β2 microglobulin; SD, standard deviation.
Abbreviations: CLL, chronic lymphocytic leukemia; β2-MG, β2 microglobulin; SD, standard deviation.
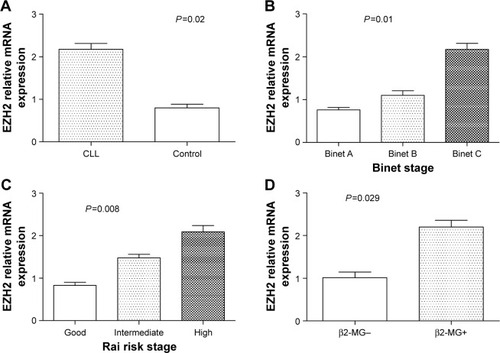
Figure 4 The mRNA expression of selected chromatin modifier genes in subjects.
Notes: The expression level of HDAC1 mRNA in patients with CLL was significantly higher than that of healthy controls (P=0.02) (A). The level of HDAC2 mRNA expression was reduced significantly in patients with CLL (P=0.002) (B), HDAC7 mRNA expression level was increased in patients with CLL (P=0.008) (C). The level of P300 mRNA expression was reduced significantly in patients with CLL (P=0.001) (D). The bars indicate the relative mRNA levels of SIRT1 (mean ± SD).
Abbreviations: CLL, chronic lymphocytic leukemia; SD, standard deviation.
Abbreviations: CLL, chronic lymphocytic leukemia; SD, standard deviation.
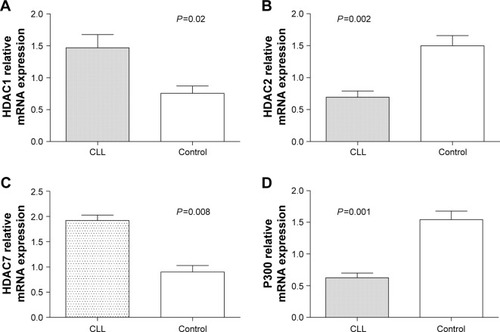
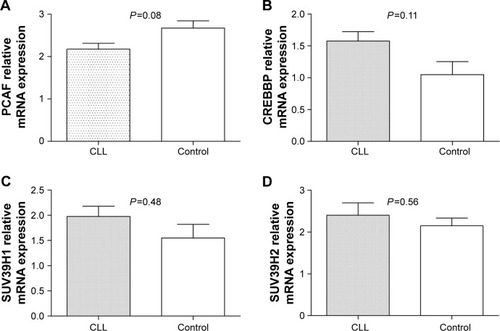
Figure 5 The mRNA expression of selected chromatin modifier genes in subjects.
Note: There was no significant difference in the expression of PCAF (A), CREBBP (B), SUV39H1 (C), and SUV39H2 (D) mRNA between patients with CLL and controls, and between any subgroups.
Abbreviation: CLL, chronic lymphocytic leukemia.
Abbreviation: CLL, chronic lymphocytic leukemia.