
Figures & data
Figure 1 Abdominal CT findings. A CT scan showing diffuse hypodense enlargement of the pancreatic head (arrow).
Abbreviation: CT, computed tomography.
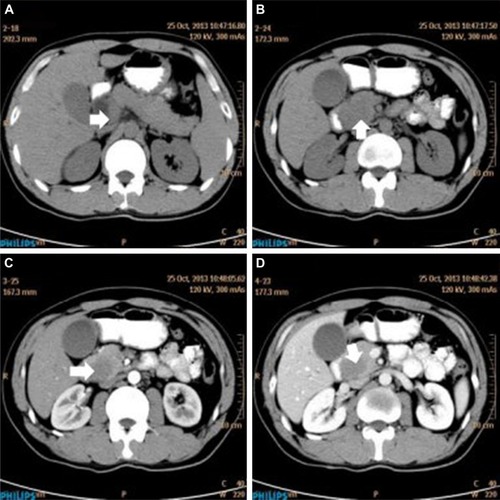
Figure 2 A gross pathological examination revealed a 3.0 × 4.0 cm multiseptated mass in the pancreatic head (arrow). The cut surface of the tumor was yellowish (arrow).
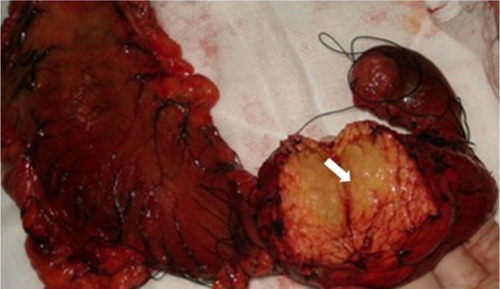
Figure 3 Histopathology showed small tumor cells without cell adhesion or tissue structure proliferation (A), and HE immunochemical staining was positive for B-cell markers CD20 and CD79a (B, C), compatible with the diagnosis of diffuse large B-cell non-Hodgkin lymphoma. HE immunochemical staining confirmed a proliferative index of over 50–60% (D). (A–C ×400; D ×200).
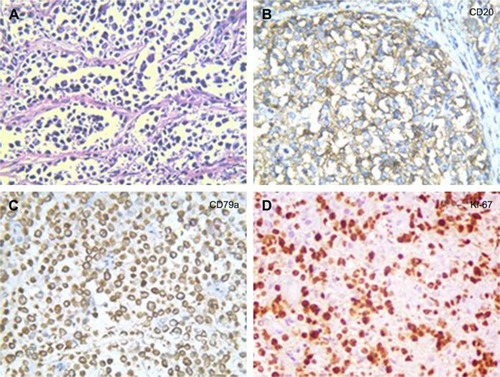
Figure 4 A PET-CT did not detect any signs of disease recurrence after 16 months.
Notes: A and B represent different planes on PET-CT.
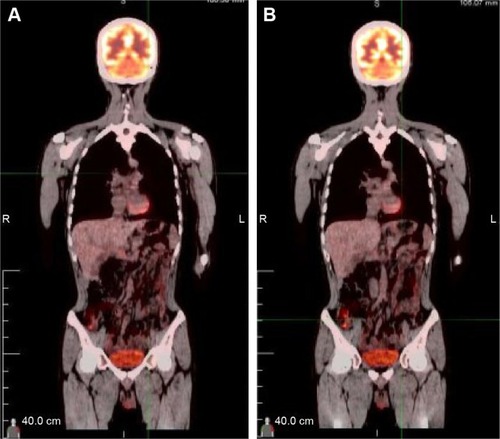
Figure 5 (A, B) A CT scan showing diffuse hypodense enlargement of the pancreatic tail (arrow).
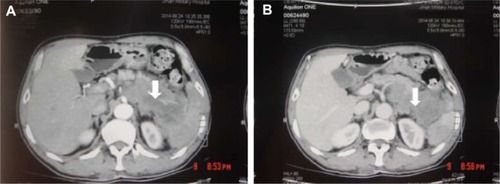
Figure 6 Pathological findings. (A) HE shows irregularly-shaped, atypical lymphocyte infiltration (×40). (B) CD20 positive atypical lymphocytic cells (×400). (C) A high Ki-67 proliferation index (80%; ×200).
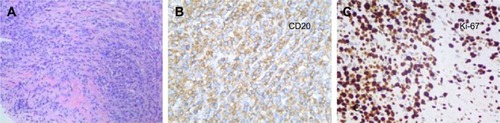
Figure 7 Lesions were significantly reduced after 2 cycles of CHOP chemotherapy regimen (A, B). After 4 cycles of CHOP chemotherapy regimen (C, D).
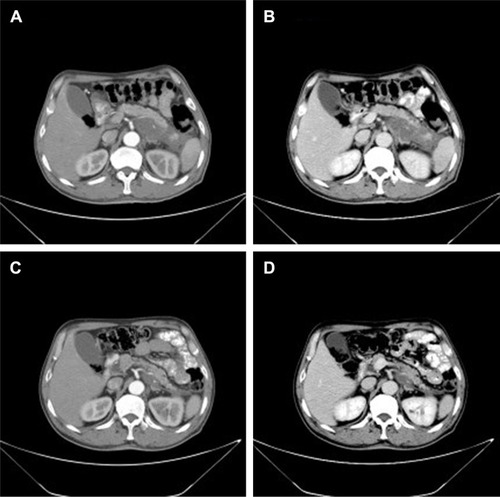
Table 1 Reported cases of primary pancreatic leiomyosarcoma in the English literature of our review