Figures & data
Table 1 Patients background
Figure 1 Kaplan–Meier curve of post-metastatic survival in bone or soft-tissue sarcoma patients (n=48) treated with metastasectomy and/or radiofrequency ablation of the lung.
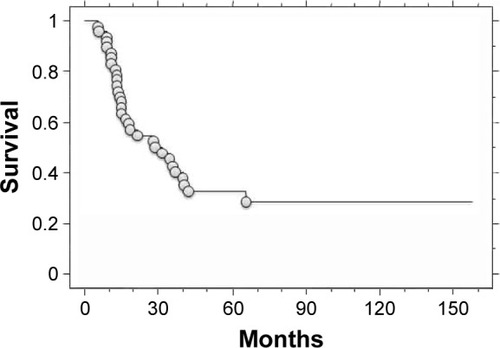
Table 2 Univariate analysis for survival
Table 3 Multivariate analysis for survival
Table 4 Predictive factors which related with curability
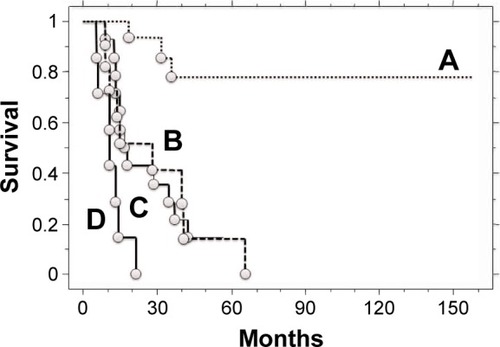
Figure 2 Kaplan–Meier curves of post-metastatic survival in bone or soft-tissue sarcoma patients (n=48) with (A) complete treatment and a tumor volume doubling time (TVDT) of >30 days, (B) incomplete treatment and a TVDT of >30 days, (C) complete treatment and a TVDT of ≤30 days, and (D) incomplete treatment and a TVDT of ≤30 days.