Figures & data
Figure 1 The role of head MRI in the evaluation of therapy response.
Notes: (A) T2W image shows left temporal bone involvement of LCH (white arrow). (B) This lesion shows inhomogenous diffusion restriction (black arrow) on the diffusion-weighted image. (C and D) Normal appearance of the left temporal area after the initial chemotherapy on T2W and diffusion-weighted images. (E and F) Signal abnormality in the left temporal area on the T2W (white arrow) and diffusion-weighted (black arrow) images.
Abbreviations: LCH, Langerhans cell histiocytosis; MRI, magnetic resonance imaging.
Abbreviations: LCH, Langerhans cell histiocytosis; MRI, magnetic resonance imaging.
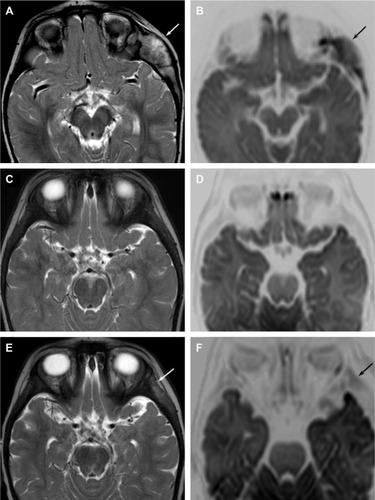
Figure 2 Skull lesion in LCH.
Notes: (A) Hematoxylin–eosin stain. Majority of the cells have coffee bean-shaped nuclei with open chromatin pattern and nuclear membrane grooves. (B) Strongly positive CD1a immune reaction, which is specific for LCH.
Abbreviation: LCH, Langerhans cell histiocytosis.
Abbreviation: LCH, Langerhans cell histiocytosis.
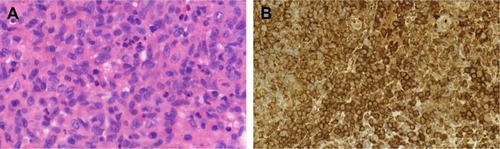
Figure 3 Massive bone marrow infiltration with ECD (original magnification).
Notes: (A) Hematoxylin–eosin stain. The marrow spaces are extensively engaged by foamy macrophages. (B) S100 immune reaction. The immune phenotype of macrophages is consistent with the phenotype of the conventional tissue histiocytes (CD68 positive, S100 negative). S100 is a highly sensitive but a nonspecific marker of Langerhans cells, therefore a good marker for screening Langerhans cells, or exclude Langerhans cell origin of a tumorous proliferation.
Abbreviation: ECD, Erdheim–Chester disease.
Abbreviation: ECD, Erdheim–Chester disease.
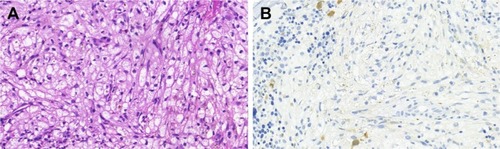
Figure 4 Plain radiograph of the knees (A) before and (B) after vemurafenib treatment.
Notes: (A) Bilateral, symmetric, irregular sclerotic changes in the metaphysis of the bones. (B) Normal bone structure with a radiolucent band and small cystic lesions next to the epiphyseal plates.
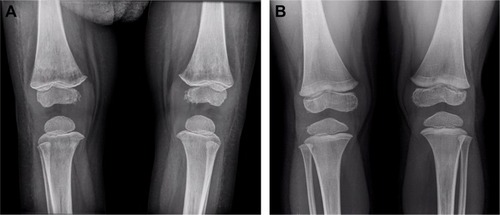
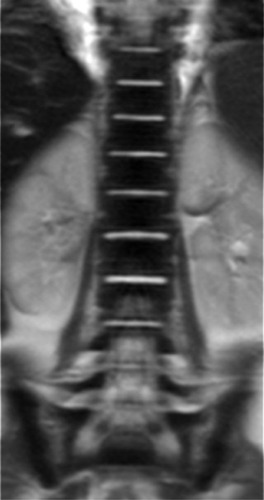
Figure 5 Coronal T2W image of the spine shows very low signal intensity of the bone marrow that is specific for ECD.
Abbreviation: ECD, Erdheim–Chester disease.