Figures & data
Table 1 Clinical and pathological data of patients in this study
Figure 1 Shared putative microRNAs potentially regulating both RASA1 and SPRED1 are identified by the prediction algorithm of TargetScan.
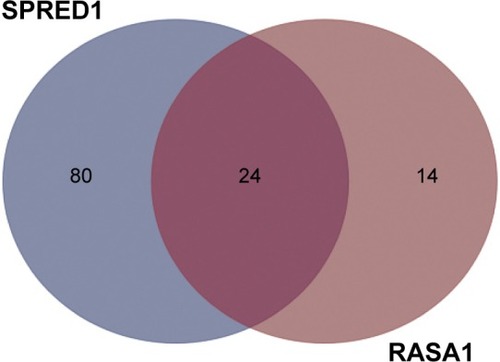
Figure 2 Expression differentiation of predicted miRNAs between malignant tissues and adjacent nonmalignant tissues from ten OSCC patients.
Abbreviations: T, malignant tumor tissues; N, adjacent nonmalignant tissues; miRNAs, microRNAs; OSCC, oral cavity squamous cell carcinoma; qRT-PCR, quantitative reverse-transcription polymerase chain reaction.
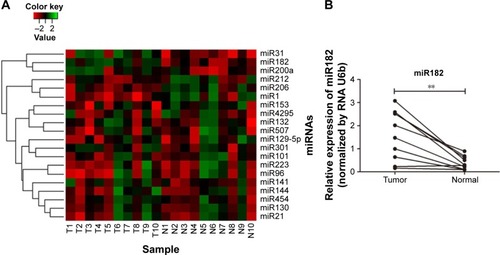
Table 2 Deregulated miRNAs potentially regulating RASA1 and SPRED1 between ten paired OSCC malignant tissues and adjacent noncancerous tissues
Figure 3 The reverse correlation of miR182 and RASA1 or SPRED1 protein levels.
Abbreviations: T, malignant tumor tissues; N, adjacent nonmalignant tissues; OSCC, oral cavity squamous cell carcinoma.
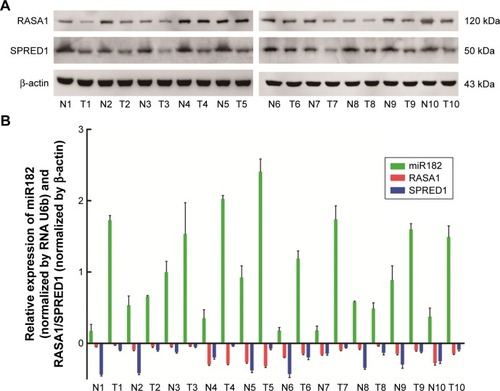
Figure 4 miR182 promotes OSCC cell proliferation and cell-cycle progression.
Abbreviations: Oligos, oligonucleotides; OSCC, oral cavity squamous cell carcinoma; NC, negative control; OD, optical density.
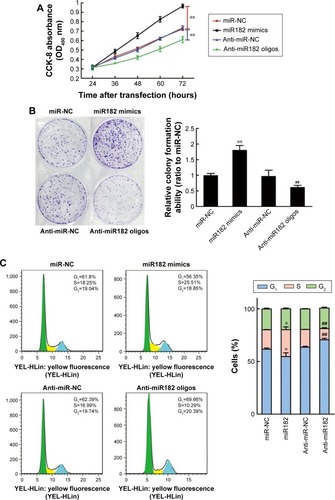
Figure 5 miR182 inhibits the apoptosis of OSCC cells.
Abbreviations: Oligos, oligonucleotides; OSCC, oral cavity squamous cell carcinoma; NC, negative control; FITC, fluorescein isothiocyanate; PI, propidium iodide.
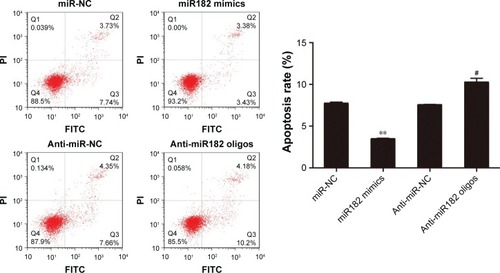
Figure 6 miR182 promotes the invasion of OSCC cells.
Abbreviations: Oligos, oligonucleotides; OSCC, oral cavity squamous cell carcinoma; NC, negative control.
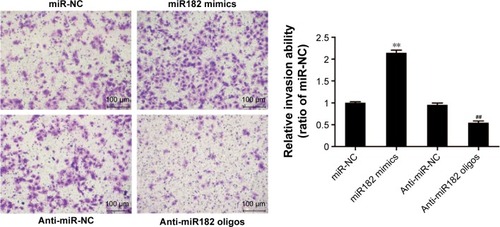
Figure 7 miR182 promotes the activation of the Ras–MEK–ERK signaling pathway by suppressing the expression of RASA1 and SPRED1.
Abbreviations: NC, negative control; p, phospho.
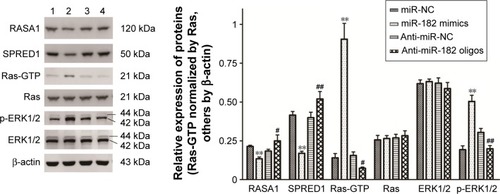
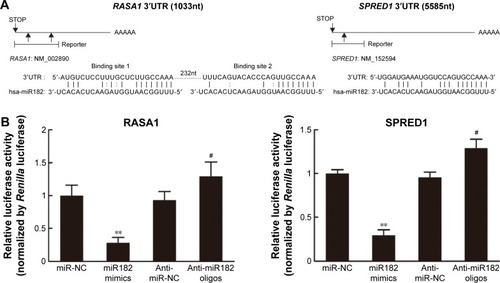
Figure 8 miR182 regulates RASA1 and SPRED1 by directly targeting their 3′UTRs.
Abbreviations: UTRs, untranslated regions; mRNAs, messenger RNAs; NC, negative control.