
Figures & data
Figure 1 Consort diagram.
Abbreviations: DLT, dose-limiting toxicity; ITT, intention-to-treat population; MTD, maximum tolerated dose population; RD, recommended dose population; RESP, response population; SAF, safety population.
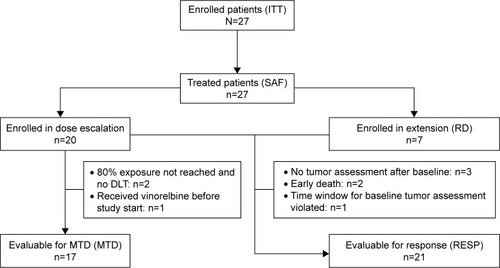
Table 1 Demographic data and disease characteristics
Table 2 Dose escalation – DLTs observed during the dose escalation phase of the trial including toxicities observed at the MTD
Figure 2 Vinorelbine blood concentrations on day 1 and day 21 (cycle 1) after daily dosing of oral vinorelbine.
Abbreviations: d, day; h, hours.
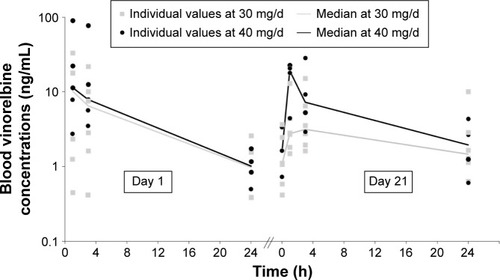
Table 3 AEs potentially related to vinorelbine occurring in at least 10% of the SAF and/or RD population
Table 4 Efficacy parameters