Figures & data
Figure 1 PET/CT (June 18, 2013) showing disease extent after first-line chemotherapy.
Notes: Compared with PET/CT images before first-line chemotherapy, this scan revealed that the nasopharyngeal mass and lymph node metastases were reduced in size, whereas liver and bone metastases had increased in size and number, indicating progressive disease.
Abbreviations: CT, computed tomography; PET, positron emission tomography.
Abbreviations: CT, computed tomography; PET, positron emission tomography.
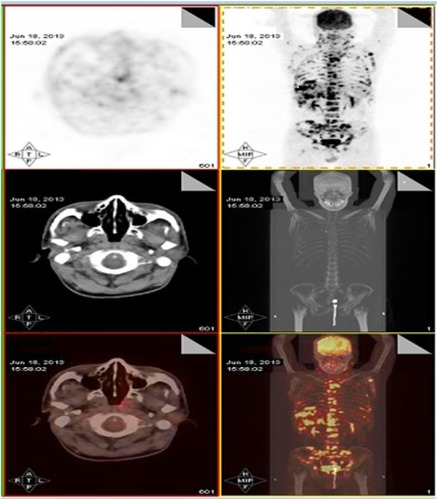
Figure 2 PET/CT (September 2, 2013) displaying relatively favorable tumor burden with bevacizumab combined with the agents already being administered.
Notes: Although bone metastases remained stable, other metastatic sites including liver metastases were reduced in size and number after addition of bevacizumab to chemotherapy.
Abbreviations: CT, computed tomography; PET, positron emission tomography.
Abbreviations: CT, computed tomography; PET, positron emission tomography.
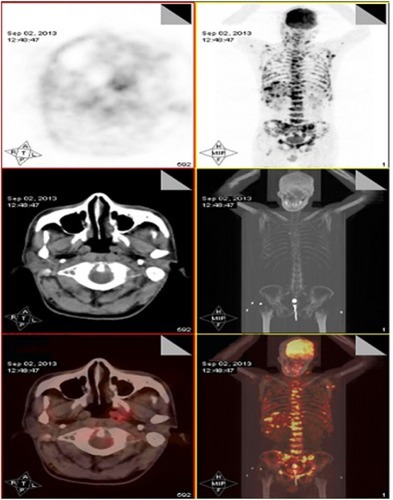
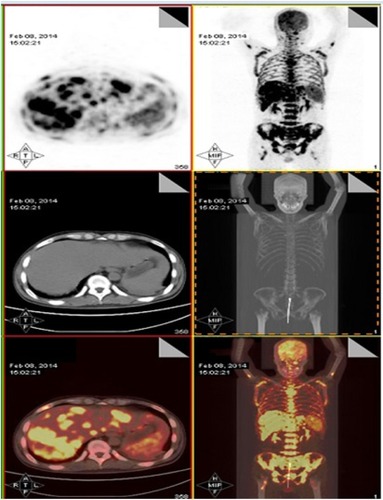
Figure 3 PET/CT (February 8, 2014) showing significantly progressive disease after changed regimen and discontinuation of treatment because of liver dysfunction.
Notes: Liver, bone, and lymph node metastases were increased in size and number.
Abbreviations: CT, computed tomography; PET, positron emission tomography.
Abbreviations: CT, computed tomography; PET, positron emission tomography.