
Figures & data
Figure 1 Study flow diagram. Arm (A) includes the individuals referred for FIT and subsequent colonoscopy; the arm (B) subsample consists of the individuals who additionally underwent real sigmoidoscopy.
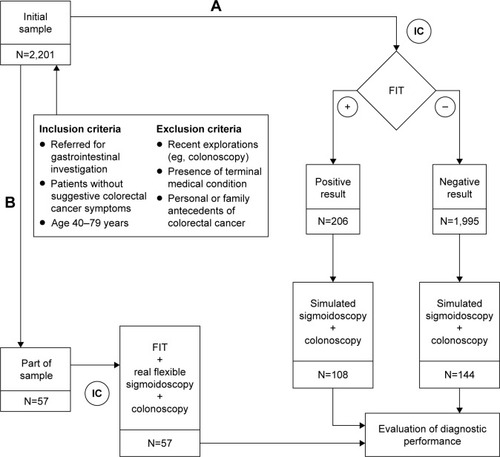
Figure 2 Scheme for testing combination.
Abbreviations: COL, colonoscopy; FIT, fecal-immunochemical test; SIG, sigmoidoscopy.
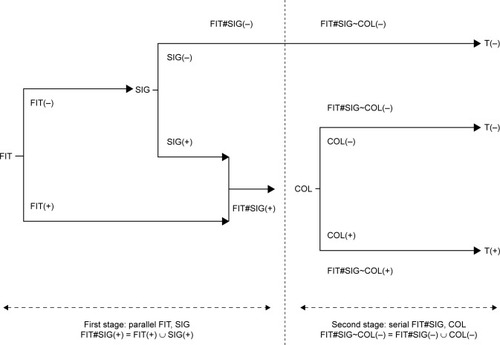
Table 1 Characteristics of individuals included in the evaluation of diagnosis reliability
Table 2 Diagnostic performance of the different testing approaches
Table 3 Parallel combination of FIT and sigmoidoscopy, as the first stage of the screening scheme proposed (N=252)
Figure 3 First stage calculated predictive values versus prevalence: FIT (left), SIG (middle), and SIG with FIT#SIG combined test (right).
Abbreviations: COL, colonoscopy; FIT, fecal-immunochemical test; SIG, sigmoidoscopy; PVP, predictive value positive; PVN, predictive value negative.
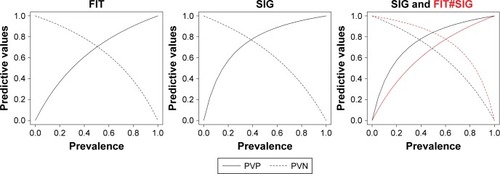
Figure 4 Second stage calculated predictive values versus prevalence: FIT#SIG combined test (left), COL (middle), and COL with FIT#SIG~COL combined test (right).
Abbreviations: COL, colonoscopy; FIT, fecal-immunochemical test; SIG, sigmoidoscopy; PVP, predictive value positive; PVN, predictive value negative.
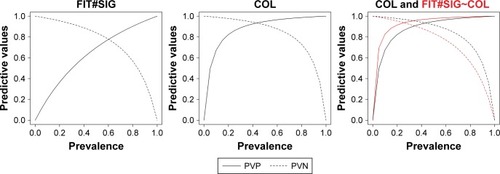
Table 4 Predictive values of FIT#SIG~COL screening strategy for colorectal neoplasia detection