
Figures & data
Table 1 Patient baseline and disease characteristics
Table 2 Distribution of subjects with first-line therapy and lines of therapy prescribed by year of mRCC diagnosis in Norwegian patients with mRCC
Figure 1 Kaplan–Meier estimates of OS in Norwegian patients diagnosed with RCC: (A) by year of diagnosis and (B) by cohorts 2002–2005, 2006–2008, and 2009–2011.
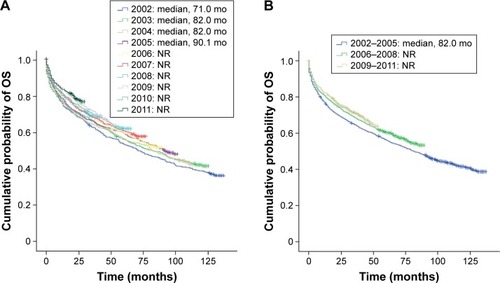
Figure 2 Kaplan–Meier estimates of OS in Norwegian patients diagnosed with mRCC: (A) by year of diagnosis and (B) by cohorts 2002–2005, 2006–2008, and 2009–2011.
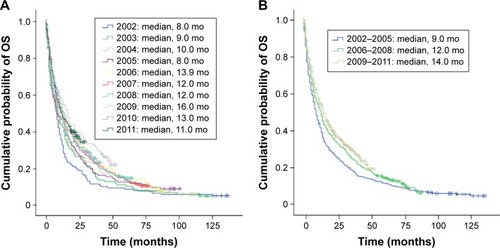
Figure 3 Kaplan–Meier estimates of OS in Norwegian patients diagnosed with mRCC of different histology.
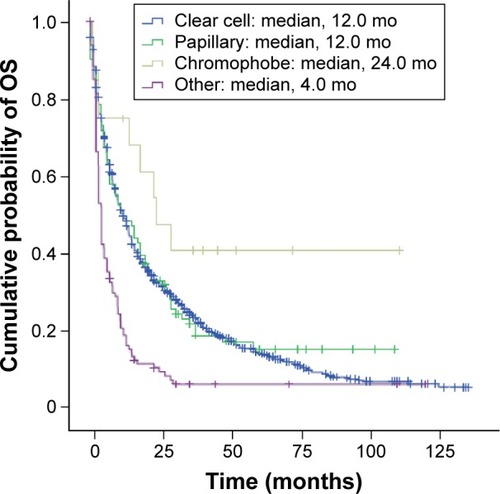
Table 3 Multivariate Cox proportional hazards regression analysis for factors predictive for OS in RCC, mRCC, and subgroups of mRCC patients in Norway diagnosed between 2002 and 2011
Figure 4 Kaplan–Meier estimates of OS adjusted by multivariate Cox proportional hazards regression analysis in Norwegian patients diagnosed with: (A) mRCC, by TT; (B) primary mRCC, by CN only, TT only, both CN and TT, and neither treatment; and (C) mRCC, who were aged 75 years or older, by TT.
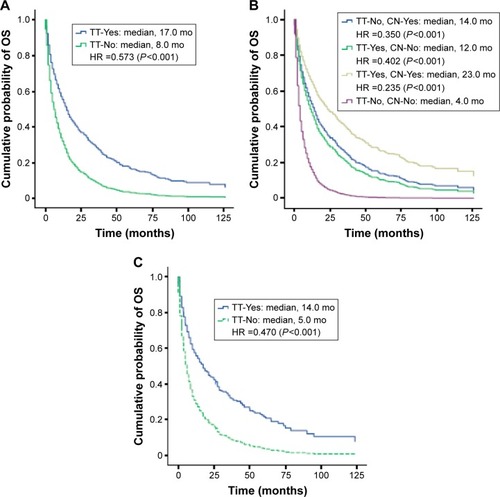
Figure S1 Kaplan–Meier estimates of OS in Norwegian patients diagnosed with primary mRCC by (A) year of diagnosis and (B) cohorts.
Abbreviations: mo, months; mRCC, metastatic renal cell carcinoma; OS, overall survival.
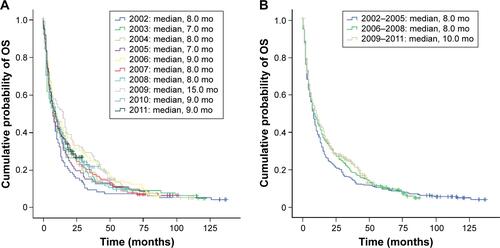
Figure S2 Kaplan–Meier estimates of OS in Norwegian patients diagnosed with mRCC who were aged 75 years or older by (A) year of mRCC diagnosis and (B) cohorts.
Abbreviations: mo, months; mRCC, metastatic renal cell carcinoma; OS, overall survival.
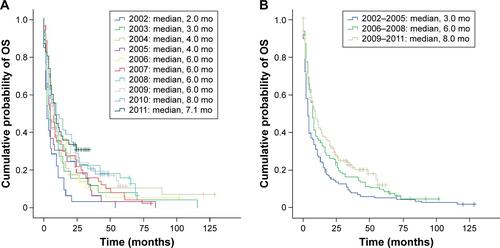
Figure S3 Kaplan–Meier estimates of OS in Norwegian patients diagnosed with mRCC by line of therapy.
Abbreviations: mo, months; mRCC, metastatic renal cell carcinoma; OS, overall survival.
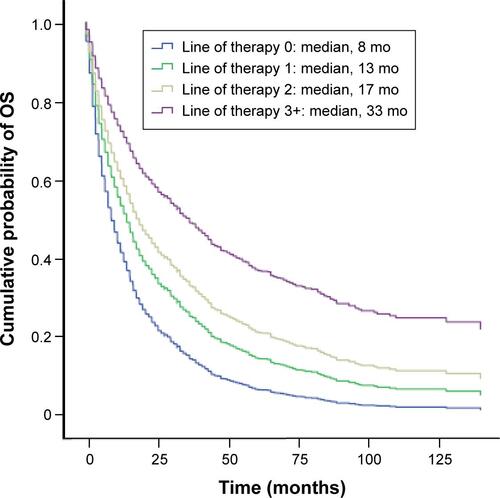
Table S1 Multivariate Cox proportional hazards regression analysis of factors, including line of therapy, predictive for OS in mRCC patients in Norway diagnosed between 2002 and 2011
Table S2 Multivariate Cox proportional hazards regression analysis by region for OS in RCC and mRCC patients in Norway diagnosed between 2002 and 2011