Figures & data
Figure 1 Effect of PD on proliferation in RPMI 8226 cells. CCK-8 assay was used to examine the cell viability after RPMI 8226 cells were treated with PD at different concentrations for 24 h and 48 h. Each group was analyzed by three independent experiments. Data are presented as mean ± SEM. *P<0.05, **P<0.01, ***P<0.001, compared to 0 μmol/L.
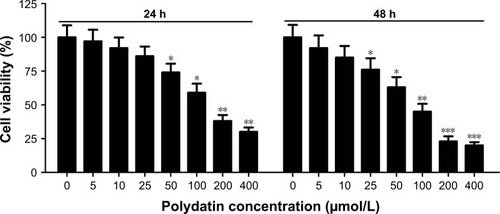
Figure 2 PD induced apoptosis of RPMI 8226 cells. (A) Apoptosis rates with different concentrations (0, 50, 100 and 200 μmol/L) of PD treatment were assessed by flow cytometry followed by Annexin V–FITC/PI staining. (B) The levels of apoptosis-associated proteins cleaved caspase-3, cleaved caspase-9, Bcl-2 and Bax in RPMI 8226 cells treated with various concentrations (0, 50, 100 and 200 μmol/L) of PD were detected by Western blot and normalized to β-actin. Each group was analyzed by three independent experiments. Data are presented as mean ± SD. *P<0.05, **P<0.01, ***P<0.001 compared to 0 μmol/L.
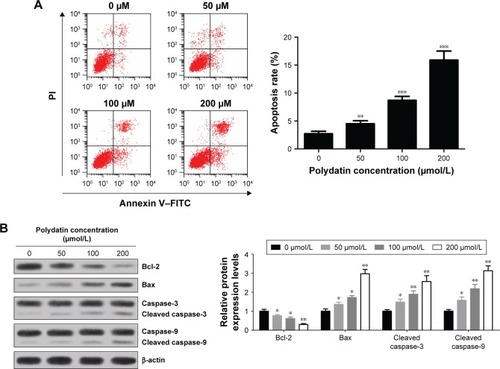
Figure 3 PD induced autophagy in RPMI 8226 cells. (A) Levels of Beclin 1, Atg5, LC3I and LC3II were determined by Western blot after cells were treated with different concentrations (0, 50, 100 and 200 μmol/L) of PD for 24 h. β-actin was used as an internal control. (B) Quantification analysis of relative proteins Beclin 1, Atg5, LC3I and LC3II in RPMI 8226 cells by Western blot. (C) The ratio of LC3II/I was calculated. (D and E) Western blot analysis of HSP70 and HSP27 in RPMI 8226 cells treated with 200 μmol/L PD for 24 h. Each group was analyzed by three independent experiments. Data are presented as mean ± SD. *P<0.05, **P<0.01, ***P<0.001, compared to 0 μmol/L.
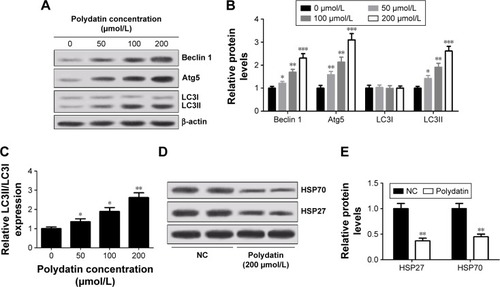
Figure 4 Viability repression, apoptosis and autophagy induced by PD were inhibited by 3-MA in RPMI 8226 cells. Cells were treated with 200 μmol/L PD alone or in combination with 10 mmol/L 3-MA for 24 h. (A) Cell viability was assessed by CCK-8 assay. (B) The apoptosis rates of RPMI 8226 cells were determined by flow cytometry. (C and D) Western blot analysis of Bcl-2, Bax, caspase-3, cleaved caspase-3, caspase-9 and cleaved caspase-9. β-actin was used as a control. (E) Quantification analysis of cleaved caspase-3 and cleaved caspase-9 by densitometry. (F) Western blot was used to analyze the expressions of Beclin 1, Atg5, LC3I and LC3II. β-actin was used as a control. (G) Quantification analysis of Beclin 1, Atg5, LC3I and LC3II. (H) The ratio of LC3II/LC3I. Data are presented as mean ± SD. *P<0.05, **P<0.01, ***P<0.001, compared to control.
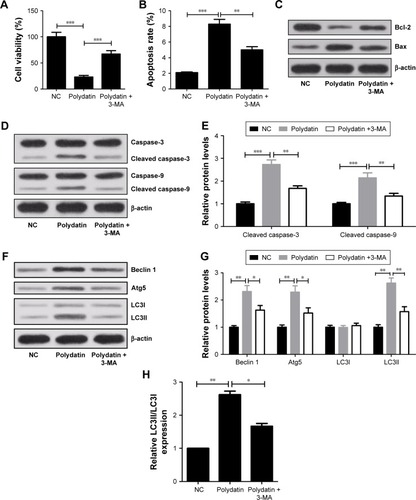
Figure 5 PD suppressed the activation of mTOR/p70s6k signaling pathway in RPMI 8226 cells. (A) Western blot analysis of p-mTOR, t-mTOR, p-p70s6k and t-p70s6k in RPMI 8226 cells treated with 200 μmol/L PD. (B) Quantification analysis of relative proteins p-mTOR, t-mTOR, p-p70s6k and t-p70s6k. Data are presented as mean ± SD. **P<0.01, compared to NC.
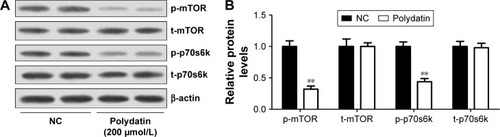
Figure 6 Effect of rapamycin on autophagy, viability and apoptosis of RPMI 8226 cells. Cells were treated with different concentrations (0, 100 and 1,000 nmol/L) of rapamycin for 24 h. (A and B) Expressions of Beclin 1, Atg5, LC3I and LC3II were determined by Western blot. β-actin was used as an internal control. (C) The ratio of LC3II/LC3I. (D) Cell viability was determined by CCK-8 kit. (E) Cell apoptosis rates were assessed by flow cytometry. (F and G) Expressions of caspase-3, cleaved caspase-3, caspase-9, cleaved caspase-9, Bcl-2 and Bax were measured by Western blot and normalized to β-actin. Data are presented as mean ± SD. *P<0.05, **P<0.01, ***P<0.001, compared to 0 μmol/L.
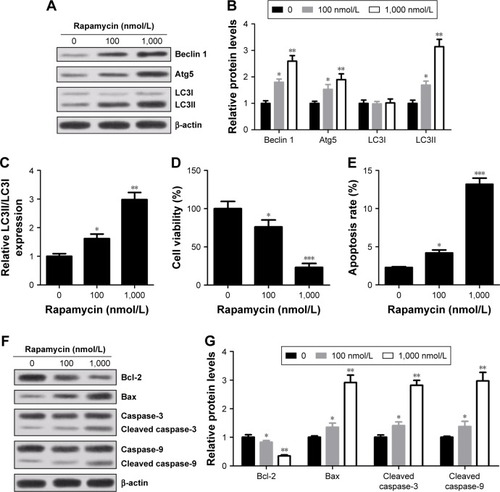
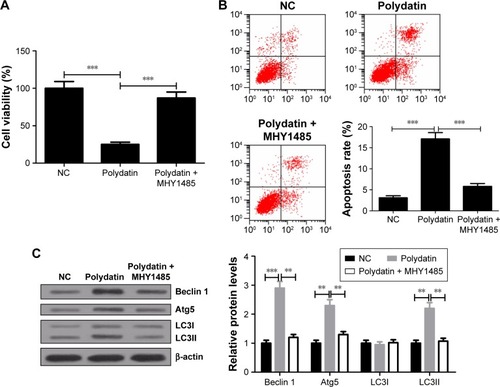
Figure 7 Viability suppression, apoptosis and autophagy induced by PD were repressed by MHY1485 in RPMI 8226 cells. Cells were treated with either 200 μmol/L PD or in combination with 10 μmol/L MHY1485 for 24 h. (A) Cell viability of RPMI 8226 cells was evaluated by CCK-8 assay. (B) Cell apoptosis in RPMI 8226 cells was examined by flow cytometry. (C) The levels of Beclin 1, Atg5, LC3I and LC3II were determined by Western blot. β-actin was used as an internal control. Data are presented as mean ± SD. **P<0.01, ***P<0.001, compared to NC.