
Figures & data
Table 1 Baseline patient and treatment characteristics in the observational data set and in patients after propensity score matching
Figure 1 Kaplan–Meier estimated curves of (A) OS and (B) PFS in patients receiving TMZ vs BSC.
Abbreviations: BSC, best supportive care; OS, overall survival; PFS, progression-free survival; TMZ, temozolomide.
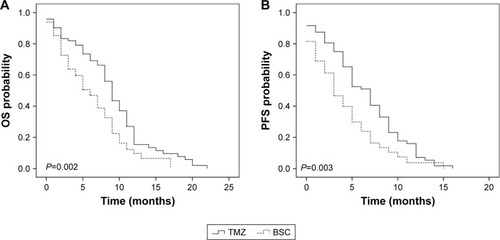
Table 2 Univariate and multivariate analyses in the propensity score-matched cohort (n=122)
Table 3 Acute hematological toxicity (TMZ group, n=78)