Figures & data
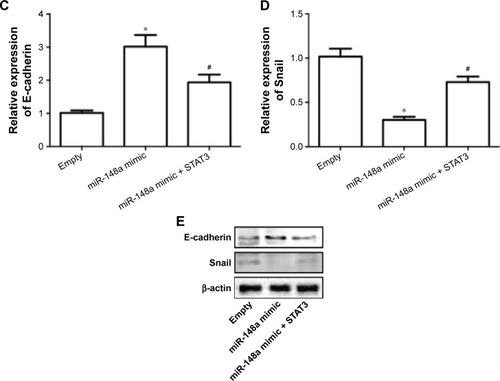
Figure 1 Relative expression of miR-148a in non-small cell lung cancer tissues and cell lines.
Notes: (A) miR-148a mRNA expression in NSCLC tumor tissues and adjacent normal lung tissues was determined and results were shown as folds of control. (B) miR-148a expression in HBE cell line and NSCLC cell lines (A549, H1299, H1650, and H460) was determined and results were shown as folds of control. *P<0.05.
Abbreviations: HBE, human bronchial epithelial; NSCLC, non-small cell lung carcinomas.
Abbreviations: HBE, human bronchial epithelial; NSCLC, non-small cell lung carcinomas.
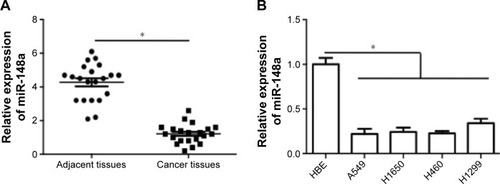
Figure 2 miR-148a reduced cell proliferation in A549 cells.
Notes: A549 cells were transfected with miR-148a plasmid (A, B) or miR-148a inhibitor (C, D). (A, C) Relative expression of miR-148a after the transfection of A549 cells with miR-148a mimic or inhibitor. (B, D) Effect of miR-148a mimic or inhibitor on cell proliferation in A549 cells was detected by Cell Counting Kit-8 assay. *P<0.05, compared with that of representative control.
Figure 3 miR-148a promoted apoptosis in A549 cells.
Notes: A549 cells were transfected with miR-148a mimic. (A, B) Relative expression of Bax was examined using real-time PCR and Western blot. (C, D) Relative expression of Bcl-2 was examined using real-time PCR and Western blot. (E, F) Activities of caspases 3 and 9 were determined using commercial assay kits. (G, H) TdT-mediated dUTP nick end labeling was used to measure apoptotic cell death and results were shown as folds of control. *P<0.05, compared with that of control.
Abbreviations: P1, population 1; PCR, polymerase chain reaction.
Abbreviations: P1, population 1; PCR, polymerase chain reaction.
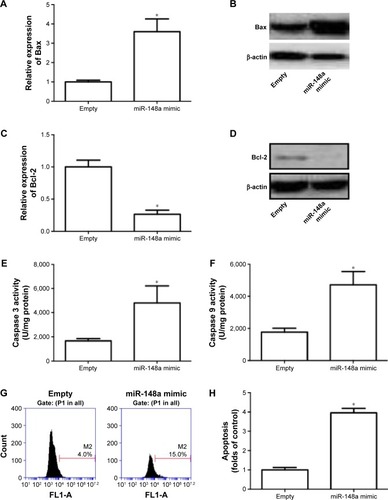
Figure 4 miR-148a decreased the invasion potential in A549 cells.
Notes: A549 cells were transfected with miR-148a mimic. Relative expression of N-cadherin (A), E-cadherin (B), vimentin (C), and Snail (D) was examined using real-time polymerase chain reaction. *P<0.05, compared with that of control.
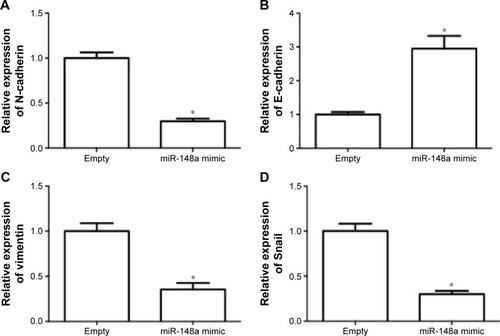
Figure 5 STAT3 was a target gene of miR-148a.
Notes: A549 cells were transfected with miR-148a plasmid or miR-148a inhibitor and or 3′-untranslated region of FoxO1 luciferase. Real-time polymerase chain reaction (A, D) and Western blot (B, E) were conducted to measure the relative expression of STAT3. Luciferase activity was determined by dual-luciferase reporter assay system (C). *P<0.05, compared with that of representative control.
Abbreviations: MUT, mutant; STAT3, signal transducer and activator of transcription 3; WT, wild type.
Abbreviations: MUT, mutant; STAT3, signal transducer and activator of transcription 3; WT, wild type.
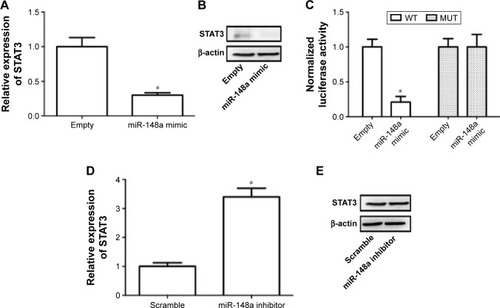
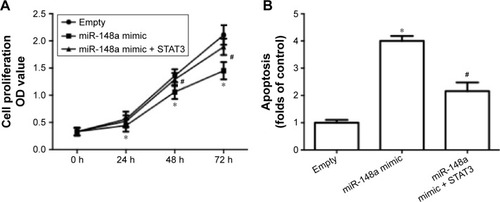
Figure 6 Upregulation of STAT3 inhibited miR-148a mimic-induced inhibition of cell proliferation and invasion in A549 cells.
Notes: A549 cells were co-transfected with miR-148a mimic and plasmid carrying STAT3. (A) Cell proliferation was detected by CCK-8 assay. (B) Apoptosis was evaluated by TUNEL assay. mRNA expression of E-cadherin (C) and Snail (D) was examined using real-time PCR. Protein expression of E-cadherin and Snail (E) was examined using Western blot. *P<0.05, compared with that of control. #P<0.05, compared with that of miR-148a mimic.
Abbreviations: CCK-8, Cell Counting Kit-8; PCR, polymerase chain reaction; OD, optical density; STAT3, signal transducer and activator of transcription 3; TUNEL, TdT-mediated dUTP nick end labeling.
Abbreviations: CCK-8, Cell Counting Kit-8; PCR, polymerase chain reaction; OD, optical density; STAT3, signal transducer and activator of transcription 3; TUNEL, TdT-mediated dUTP nick end labeling.