
Figures & data
Figure 1 Schematic overview of the effect of EWSR1-FLI1oncoprotein on IGF-1 pathway in Ewing sarcoma cells.
Note: EWSR1-FLI1 binds the promoter region of IGF-BP3, which inhibits transcription.
Abbreviations: EWSR1-FLI1, Ewing sarcoma breakpoint region 1-Friend leukemia virus integration 1; IGF-1, insulin-like growth factor 1; IGF-BP3, insulin-like growth factor-binding protein 3; IGF-2, insulin-like growth factor 2; IGF-1R, insulin-like growth factor 1 receptor; IR-A, insulin receptor isoform A; PI3K, phosphatidylinositol- 3-kinase; AKT, protein kinase B; MAPK, mitogen-activated protein kinase.
Abbreviations: EWSR1-FLI1, Ewing sarcoma breakpoint region 1-Friend leukemia virus integration 1; IGF-1, insulin-like growth factor 1; IGF-BP3, insulin-like growth factor-binding protein 3; IGF-2, insulin-like growth factor 2; IGF-1R, insulin-like growth factor 1 receptor; IR-A, insulin receptor isoform A; PI3K, phosphatidylinositol- 3-kinase; AKT, protein kinase B; MAPK, mitogen-activated protein kinase.
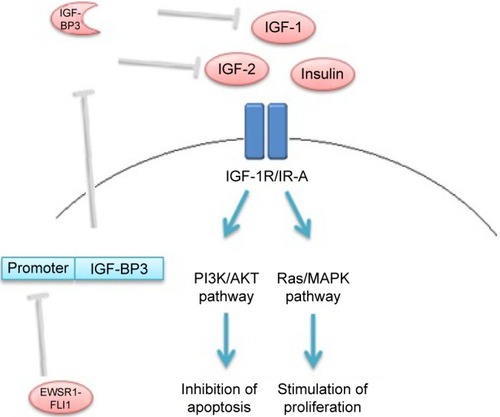
Table 1 Patient characteristics
Figure 2 Serum levels of IGF-1, IGF-BP3, and IGF-2 at baseline and after five cycles of VIDE chemotherapy (N=13).
Abbreviations: IGF-1, insulin-like growth factor 1; IGF-BP3, insulin-like growth factor binding protein 3; IGF-2, insulin-like growth factor 2; VIDE, vincristine/ifosfamide/doxorubicin/etoposide; CI, confidence interval.
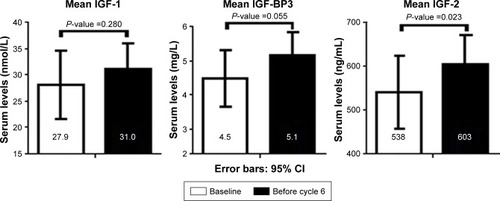
Figure 3 Kaplan–Meier curves of event-free survival (left column) and overall survival (right column) for IGF-1, IGF-BP3, and molar IGF-1 (nm/L):IGF-BP3 (nm/L) ratio levels under or above the cutoff point.
Note:
P-values are given for the univariate analyses of the Cox regression analyses.
Abbreviations: IGF-1, insulin-like growth factor 1; IGF-BP3, insulin-like growth factor-binding protein 3; EFS, event-free survival; OS, overall survival.
Abbreviations: IGF-1, insulin-like growth factor 1; IGF-BP3, insulin-like growth factor-binding protein 3; EFS, event-free survival; OS, overall survival.
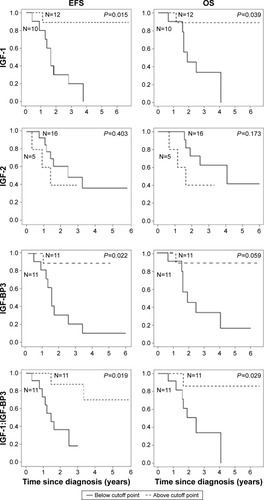
Table 2 Univariate and multivariate Cox models of EFS for IGF-1, IGF-BP3, IGF-2, and IGF-1:IGF-BP3