Figures & data
Figure 1 Expression pattern of Tbx2 in human astrocytoma.
Notes: (A) Immunohistochemical staining of Tbx2 protein in normal brain tissue was negative in glial cells and weak in neurons. (B) Negative Tbx2 staining in Grade II astrocytoma. (C) Positive nuclear Tbx2 staining in Grade III astrocytoma. (D) Positive nuclear Tbx2 staining in GBM (Grade IV). (E) Overall survival of patients with all grades of astrocytoma. (F) Overall survival of patients with GBM (Grade IV). Magnification 400×.
Abbreviation: GBM, glioblastoma multiform.
Abbreviation: GBM, glioblastoma multiform.
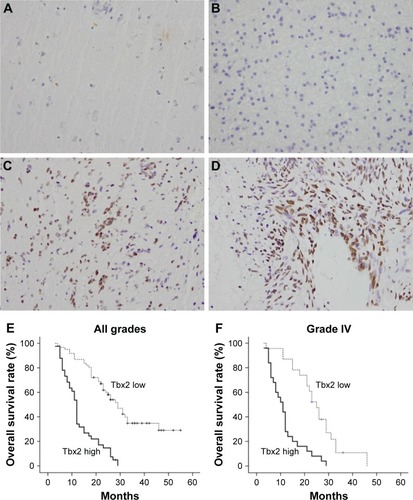
Table 1 The relationship between Tbx2 and clinical features of astrocytoma
Table 2 Univariate and multivariate analysis for predictive factors in patients with astrocytoma (Cox regression model)
Figure 2 Tbx2 overexpression correlates with proliferation and invasion.
Notes: (A) Western blot and RT-PCR analysis showed that Tbx2 protein expression was high in U251 cell line and low in U87 and A172 cell lines. (B) Tbx2 siRNA treatment decreased its mRNA and protein expression in U251 cells. Tbx2 plasmid transfection upregulated its mRNA and protein levels. (C) CCK8 assay demonstrated that Tbx2 overexpression accelerated cell growth rate, while Tbx2 depletion inhibited cell proliferation. Cell growth rate was higher in U251 cell line than other cell lines. (D) Matrigel invasion assay showed that Tbx2 depletion decreased cell invasion in U251 cell line. Tbx2 plasmid transfection increased the number of invading cells. *P<0.05.
Abbreviations: RT-PCR, real-time polymerase chain reaction; CCK8, Cell Counting Kit-8.
Abbreviations: RT-PCR, real-time polymerase chain reaction; CCK8, Cell Counting Kit-8.
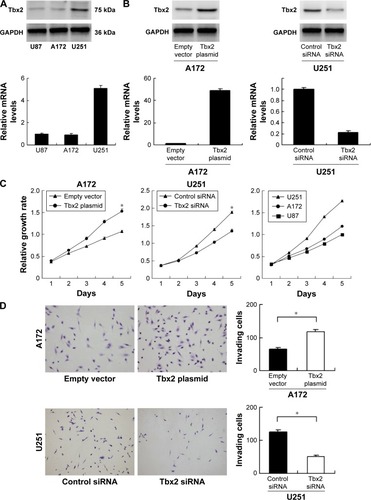
Figure 3 Tbx2 regulates mitochondrial fission/fusion and related proteins.
Notes: (A) Mitochondrial morphology was evaluated by confocal microscope using MitoTracker Green staining. Mitochondrial dynamics were prone to fission after Tbx2 overexpression in A172 cells. Tbx2 depletion led to mitochondrial fusion in U251 cells. (B) Tbx2 overexpression upregulated mean mtDNA content in A172 cells with Tbx2 plasmid. In contrast, Tbx2 depletion decreased mtDNA content in U251 cells. (C) Tbx2 overexpression upregulated cyclin D1, MMP9, p-Drp1, and MMP2 and downregulated p21 in A172 cell line. Tbx2 depletion downregulated cyclin D1, MMP9, p-Drp1, and MMP2 and upregulated p21 in U251 cell line. *P<0.05.
Abbreviation: mtDNA, mitochondrial DNA.
Abbreviation: mtDNA, mitochondrial DNA.
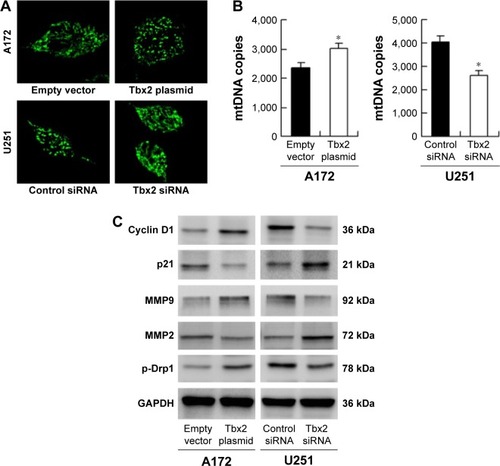
Figure 4 Tbx2 regulates cell cycle and TMZ resistance in GBM cell lines.
Notes: (A) Cell cycle analysis showed that Tbx2 overexpression increased the proportion of cells in S phase. Tbx2 depletion downregulated the proportion of cells in S phase. (B) CCK8 assay showed that Tbx2 depletion decreased cell viability with TMZ (50 μM) treatment. Tbx2 overexpression upregulated cell viability with TMZ (50 μM) treatment. *P<0.05.
Abbreviations: GBM, glioblastoma multiform; TMZ, temozolomide; CCK8, Cell Counting Kit-8.
Abbreviations: GBM, glioblastoma multiform; TMZ, temozolomide; CCK8, Cell Counting Kit-8.
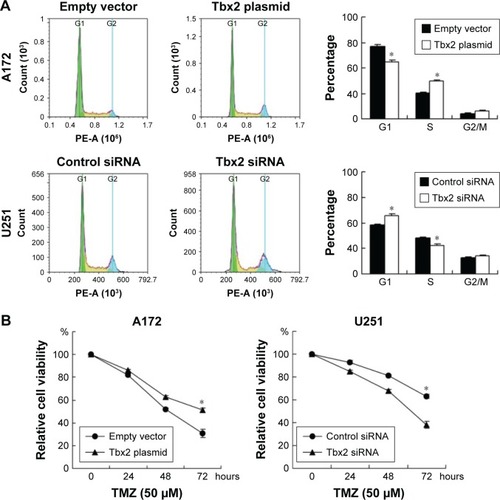
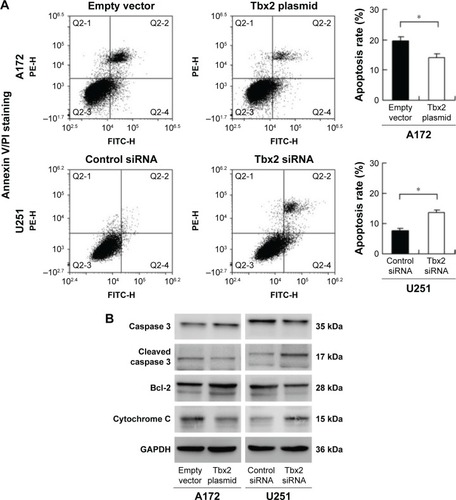
Figure 5 Tbx2 alleviated TMZ-induced apoptosis in GBM cell lines.
Notes: (A) Annexin V/PI staining and flow cytometry analysis showed that Tbx2 downregulated apoptosis rate induced by TMZ treatment in A172 cells. Tbx2 siRNA upregulated apoptosis induced by TMZ in U251 cells. (B) Tbx2 overexpression upregulated Bcl-2 and caspase 3 and downregulated cleaved caspase 3 and cytochrome C in A172 cell line. Tbx2 depletion downregulated Bcl-2 and caspase 3 and upregulated cleaved caspase 3 and cytochrome C in U251 cell line. *P<0.05.
Abbreviations: GBM, glioblastoma multiform; PI, propidium iodide; TMZ, temozolomide.
Abbreviations: GBM, glioblastoma multiform; PI, propidium iodide; TMZ, temozolomide.