
Figures & data
Table 1 Clinical features of subjects in the case and control groups
Figure 1 Contrast-enhanced ultrasound images in the case (A) and control groups (B).
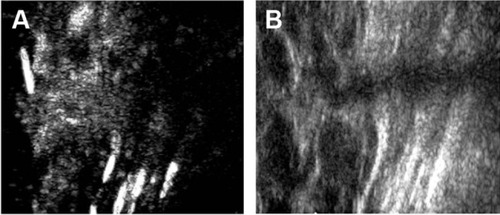
Table 2 Comparisons of contrast enhanced ultrasonography features between the case and control groups
Table 3 Comparisons of time–intensity curves between the case and control groups
Table 4 Logistic regression analysis of contrast-enhanced ultrasound parameters on time–intensity curves
Figure 2 Receiver operating characteristic (ROC) curve analysis of the diagnostic value of the uniformity of lesion enhancement in breast cancer.
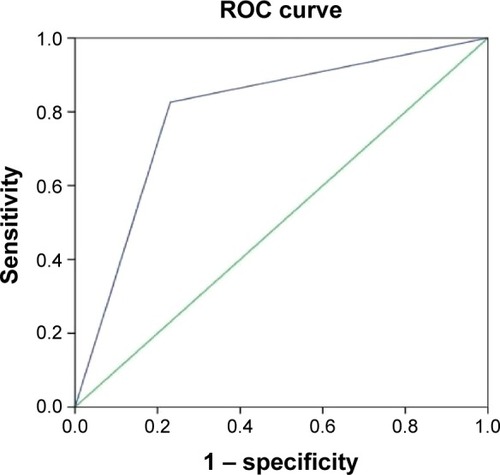
Figure 3 Receiver operating characteristic (ROC) curve analysis of the diagnostic value of the expansion of lesion diameter in breast cancer.
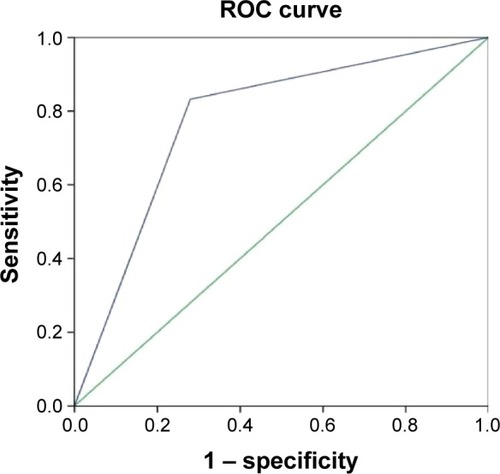
Figure 4 Receiver operating characteristic (ROC) curve analysis of the diagnostic value of the relative peak intensity in breast cancer.
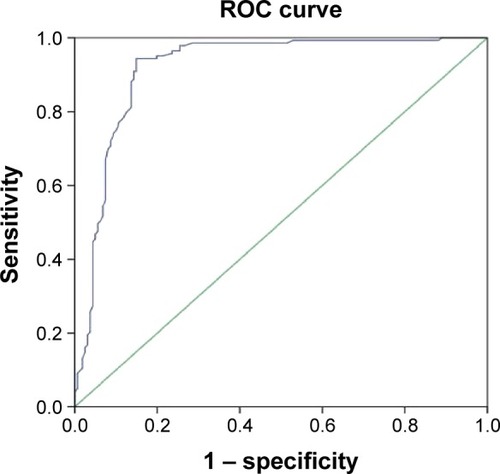
Table 5 Contrast-enhanced parameters and the prognostic factors in breast cancer