
Figures & data
Figure 1 Flow diagram of the studies selection process.
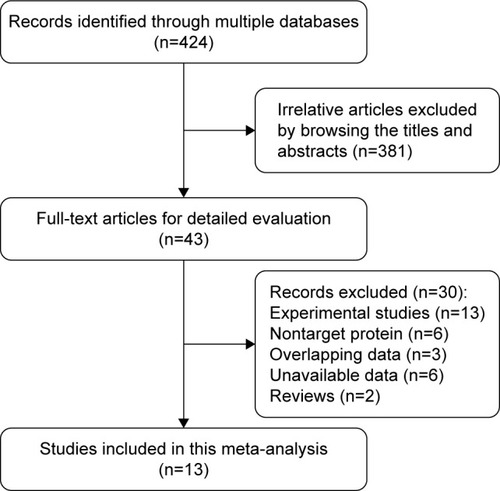
Table 1 Characteristics of studies included in our meta-analysis
Figure 2 Forest plots of ORs for the correlation between CD133 overexpression and ER, PR, and HER2.
Abbreviations: OR, odds ratio; CI, confidence interval; ER, estrogen receptor; PR, progesterone receptor; HER2, human epidermal growth factor-2.
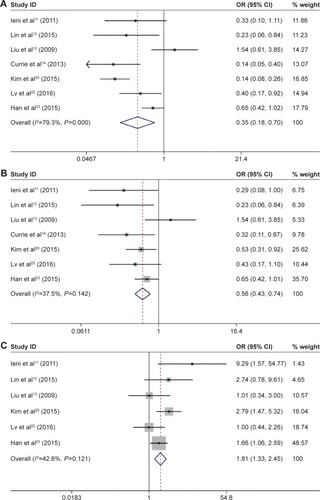
Table 2 Stratified analysis of pooled hazard ratios or odds ratios of breast cancer patients with CD133 expression on survival data and clinicopathological features
Figure 3 Forest plots of ORs for the correlation between CD133 overexpression and age, tumor size, lymph node metastasis, and tumor histological grade.
Abbreviations: OR, odds ratio; CI, confidence interval.
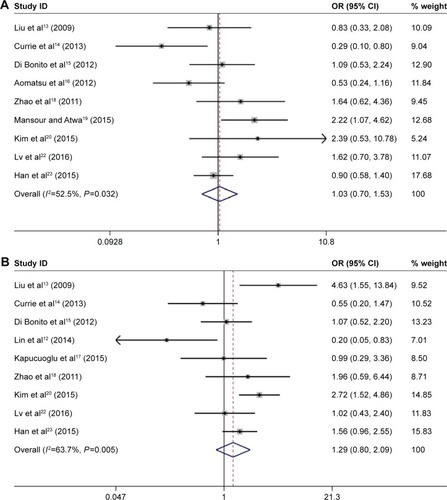
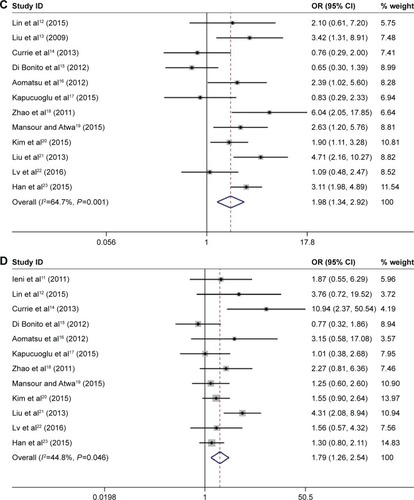
Figure 4 Forest plots of HRs for the association between CD133 overexpression and survival.
Abbreviations: HR, hazard ratio; CI, confidence interval; OS, overall survival; DFS, disease-free survival.
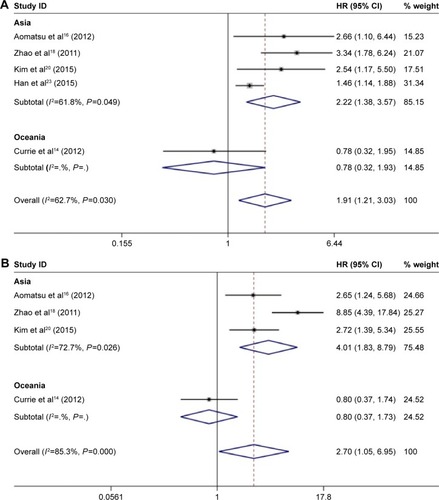
Figure 5 (A) Begg’s funnel plot for the assessment of publication bias in analysis of OS; (B) Begg’s funnel plot for the assessment of publication bias in analysis of DFS.
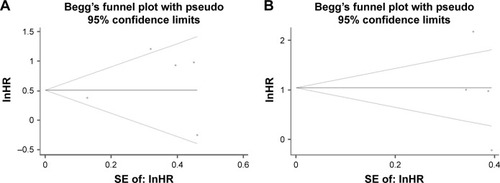
Table S1 Newcastle–Ottawa quality assessment scale (cohort studies)