
Figures & data
Table 1 Relationship between pretreatment LMR and clinicopathological parameters in patients with ESCC who received definitive chemoradiotherapy
Table 2 Univariate and multivariate analyses for tumor response (CR and non-CR)
Table 3 Multivariate analysis for tumor response (CR and non-CR)
Figure 1 Kaplan–Meier curves for patients with low and high LMR.
Notes: (A) Kaplan–Meier curves for PFS and (B) Kaplan–Meier curves for OS.
Abbreviation: LMR, lymphocyte–monocyte ratio.
Abbreviation: LMR, lymphocyte–monocyte ratio.
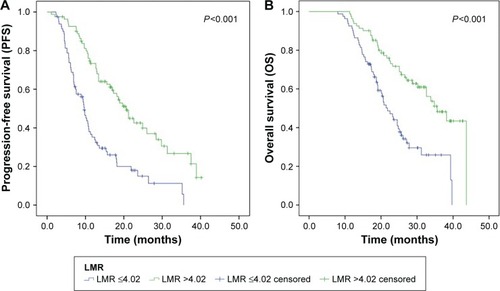
Table 4 Univariate analysis of factors associated with PFS and OS
Table 5 Multivariate analysis of factors associated with PFS and OS