
Figures & data
Table 1 Patient clinical information
Table 2 Treatment methods
Figure 1 Cumulative survival time of patients with different single organ metastases.
Notes: The survival time of patients with different metastatic organs was significantly different (P<0.01), with bone metastasis relatively longer, but liver metastasis shorter.
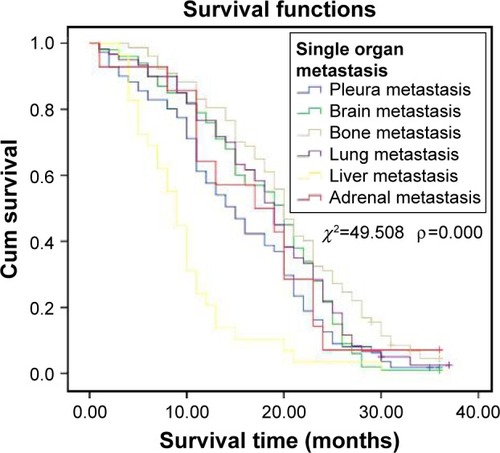
Figure 2 Cumulative survival of patients with single organ metastasis and multiple organ metastases.
Notes: The survival time of patients with single organ metastasis, two organ metastases, and three or more organ metastases were significantly different (P<0.01), and single organ metastasis was better than two or more organ metastases.
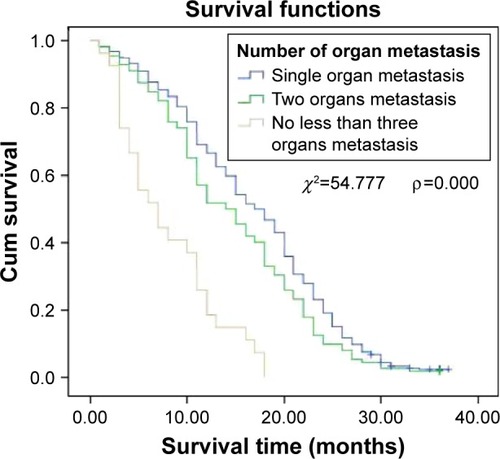
Figure 3 Cumulative survival of patients with solitary and multiple brain metastases.
Notes: The survival time of patients with solitary brain metastasis was better than multiple brain metastases (P<0.05).
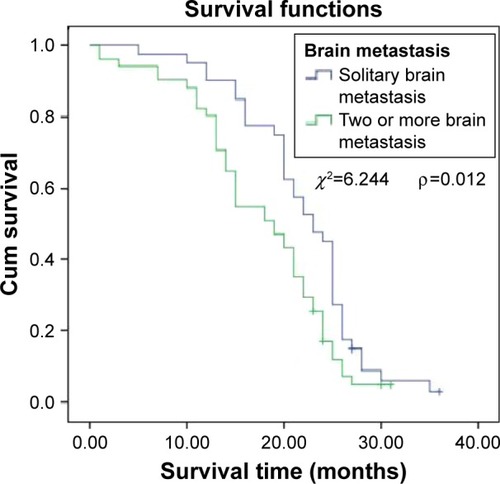
Figure 4 Relationship between radiation dose and survival in patients with brain metastases.
Notes: The radiation dose influenced survival time of patients, and the dose ≥60 Gy was better than 50–59 Gy or <50 Gy (P<0.01).
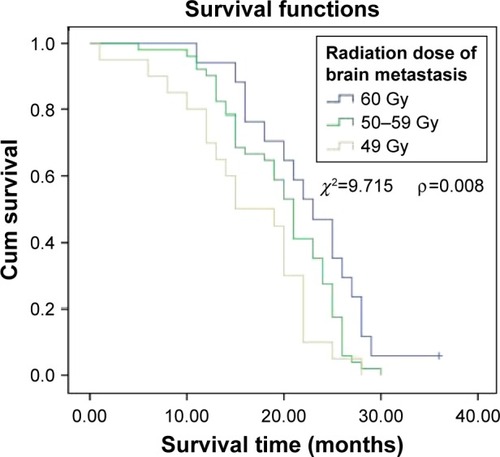
Figure 5 Effects of different treatment methods on survival.
Notes: The different therapy influenced survival time of patients, and the comprehensive therapy was better than others (P<0.01).
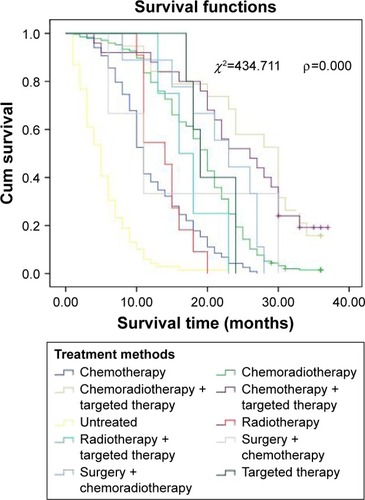
Figure 6 Comparison of survival times between treated and untreated patients.
Notes: The survival time of patients who received therapy was significantly longer than in patients that did not receive therapy (P<0.01).
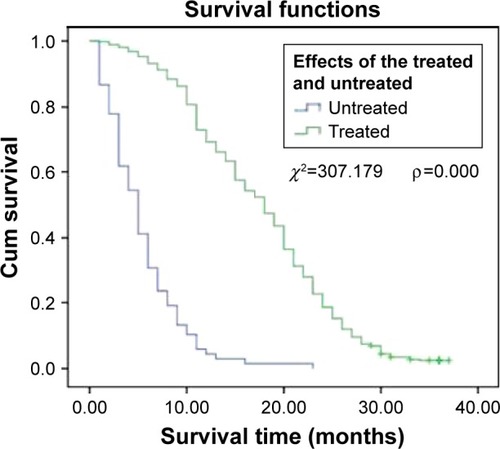
Table 3 Multivariate correlation analysis related to survival