
Figures & data
Table 1 Clinical characteristics of patients
Figure 1 The analysis of survival time.
Abbreviations: CI, confidence interval; PFS, progression-free survival time; OS, overall survival time.
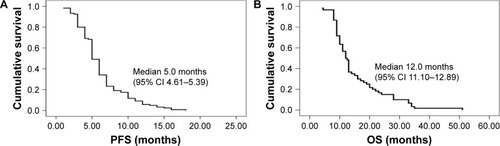
Figure 2 The analysis of survival time according to AEP expression.
Abbreviations: AEP, asparaginyl endopeptidase; PFS, progression-free survival time; OS, overall survival time.
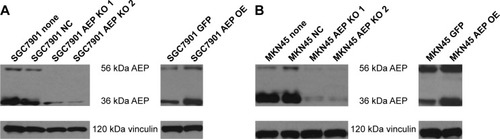
Table 2 The expression level of AEP in the serum of gastric cancer patients’ peripheral blood with different clinical response
Table 3 The expression of AEP in the serum of peripheral blood at baseline and the survival time
Figure 3 Construction of stable AEP knockout and overexpressive gastric cancer cell lines and the sensitivity to different chemotherapeutic drugs.
Abbreviations: AEP-KO, asparaginyl endopeptidase knockout; AEP-OE, AEP overexpression; NC, negative control; 5-FU, 5-fluorouracil.

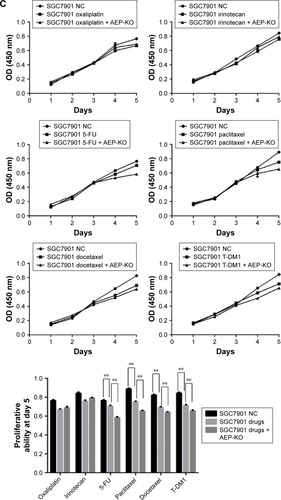
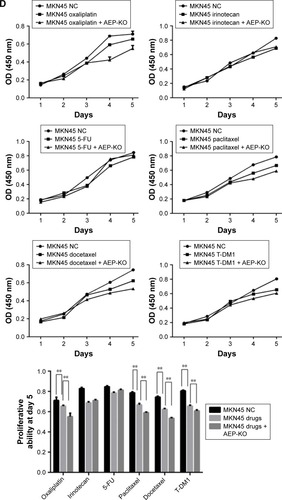
Figure 4 Analysis of AEP interacting proteins.
Abbreviations: AEP, asparaginyl endopeptidase; MAPK, mitogen-activated protein kinase.
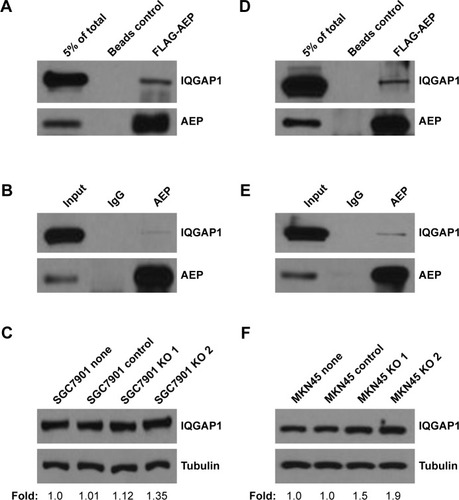
Figure 5 IQGAP1 could interact with AEP in gastric cancer cells.
Abbreviations: AEP, asparaginyl endopeptidase; KO, AEP knockout.

Figure 6 AEP and MDR1 were decreased at mRNA level when AEP was knocked out, both in SGC7901 (A) and MKN45 (B) gastric cancer cell lines.
Abbreviations: AEP, asparaginyl endopeptidase; NC, negative control; KO, AEP knockout.
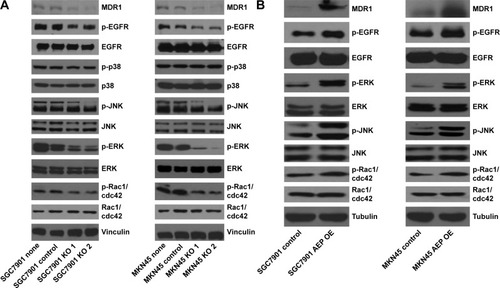
Figure 7 JNK and ERK signaling pathways and MDR1 were inhibited in AEP knockout gastric cancer cell lines, and vice versa.
Abbreviations: AEP-KO, asparaginyl endopeptidase knockout; AEP-OE, AEP overexpression; IC50, half maximal inhibitory concentration.

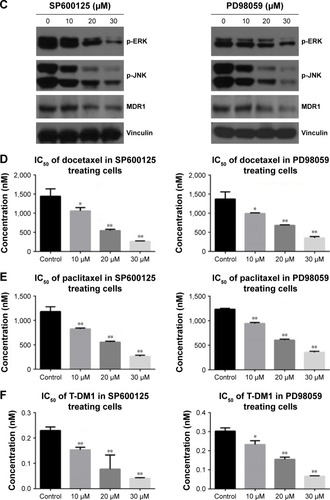
Figure S1 Expression of genes in EGFR/mitogen-activated protein kinase signaling pathway at mRNA level. There was no change in these genes when AEP was knocked out.
Abbreviations: AEP, asparaginyl endopeptidase; NC, negative control; KO, AEP knockout.
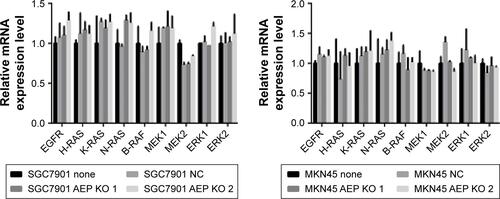
Table S1 The concentration of chemotherapeutic agents and targeting drugs
Table S2 The primer sequence of real-time polymerase chain reaction
Table S3 The interacting proteins involving >10 peptides in SGC7901 gastric cancer cell line
Table S4 The interacting proteins involving >10 peptides in MKN45 gastric cancer cell line
Table S5 Resensitizing AEP-OE MKN45 cells to taxanes and T-DM1 using inhibitors of JNK or ERK signaling pathway