
Figures & data
Table 1 Characteristics of patients with osteosarcoma, n (%)
Figure 1 Fluorescence microscopy images of three types of CTCs isolated from the peripheral blood osteosarcoma patients, based on RNA-ISH staining of epithelial (red dots) and mesenchymal (green dots) markers.
Abbreviations: CTCs, circulating tumor cells; ISH, in situ hybridization.
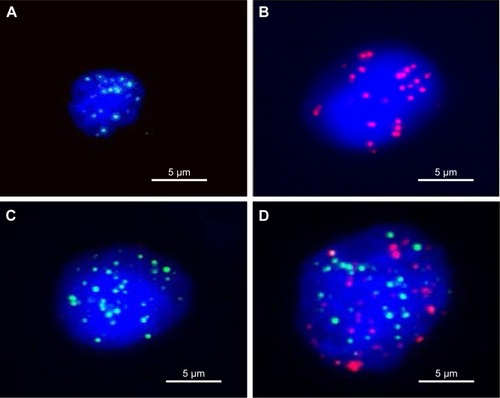
Table 2 Comparison of the CTC counts and the proportion of different CTC types between stage IIB and stage IIIB of patients with osteosarcoma
Table 3 Different expression levels of Ezrin gene in CTCs of stage IIB and stage IIIB of patients with osteosarcoma
Figure S1 Calibration curve obtained using the CanPatrol™ CTC enrichment technique in the spiking experiment (n=5) using 143B cells at different dilutions.
Abbreviation: CTCs, circulating tumor cells.
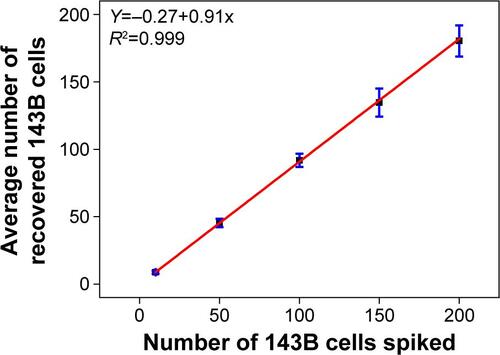
Table S1 The expression rates of the Ezrin gene in different types of CTCs