Figures & data
Figure 1 Immunostaining demonstrating the expression of ARHI in ESCC tissues.
Abbreviations: ARHI, aplysia ras homolog I; ESCC, esophageal squamous cell carcinoma.
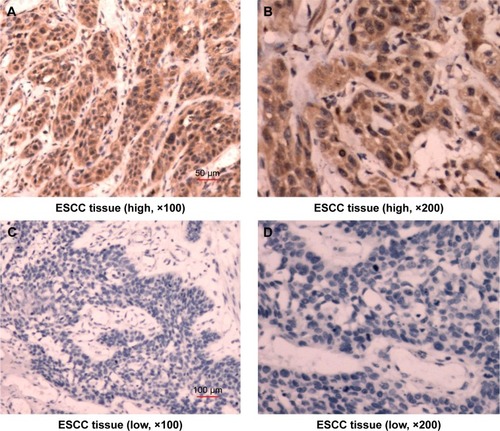
Table 1 Relationship between ARHI expression and clinical pathological features
Figure 2 (A) Kaplan–Meier analysis of the correlation between ARHI expression level and overall survival; (B) the relative expression levels of ARHI were determined by western blotting; (C) cell proliferation was assessed daily for 5 days using the Cell Counting Kit-8 assay in ESCC cells.
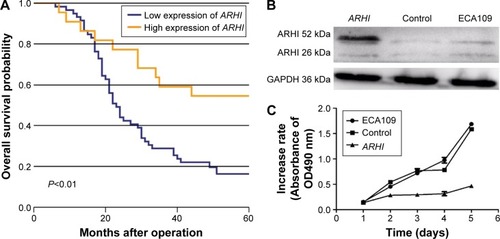
Table 2 Univariate and multivariate analyses of survival in ESCC
Figure 3 (A) Transwell assays were used to assay the involvement of ARHI for invasion in ESCC cells, original magnification ×200; (B) the cell counts of the ECA109 group, control group, and ARHI group; (C) wound assays were monitored at 0, 24, 48, and 72 h in ESCC cells, original magnification ×100. **P<0.01.
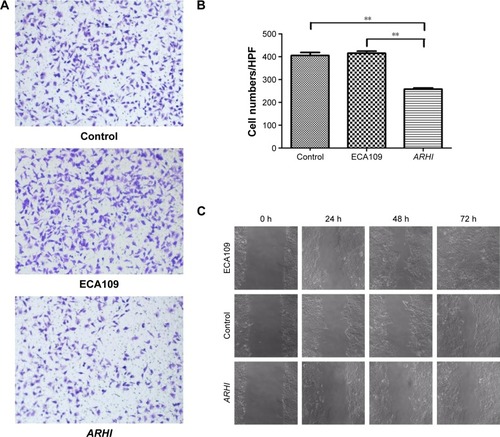
Figure 4 (A) The translational levels of invasive, autophagy, and EMT-related markers were determined by western blotting; (B) cells were stained with both Annexin V-APC and PI, and cells that were positive for Annexin V-APC were counted as apoptotic cells; (C) the proportion of apoptotic cells for ECA109 group, control group, and ARHI group, **P<0.01.
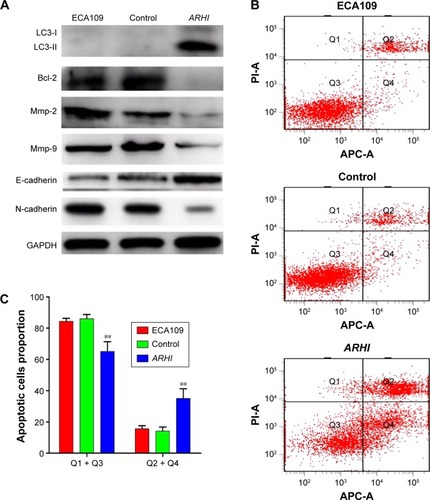
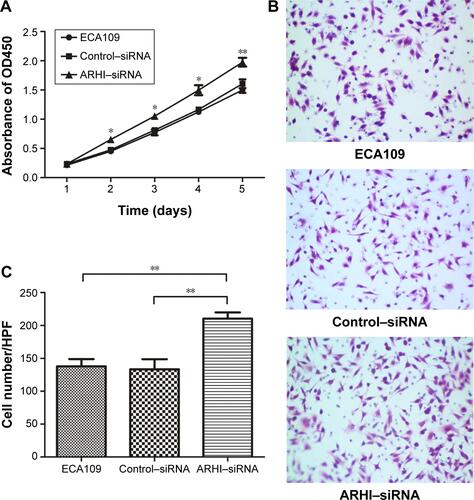
Figure S1 (A) Cell proliferation was assessed daily for 5 days using the Cell Counting Kit-8 assay in ECA109 group, Control-siRNA group and ARHI-siRNA group; (B) Transwell assays were used to examine the involvement of ARHI for invasion in ECA109 group, control–siRNA group, and ARHI–siRNA group (original magnification ×200); (C) the cell counts of the ECA109 group, control–siRNA group, and ARHI–siRNA group in transwell assays.
Notes: *P<0.05, **P<0.01.
Abbreviations: ARHI, aplysia ras homolog I; siRNA, small interfering RNA; HPF, high power field.