Figures & data
Figure 1 Flow diagram of the study selection process.
Abbreviations: CNKI, Chinese National Knowledge Infrastructure; VEGF, vascular endothelial growth factor.
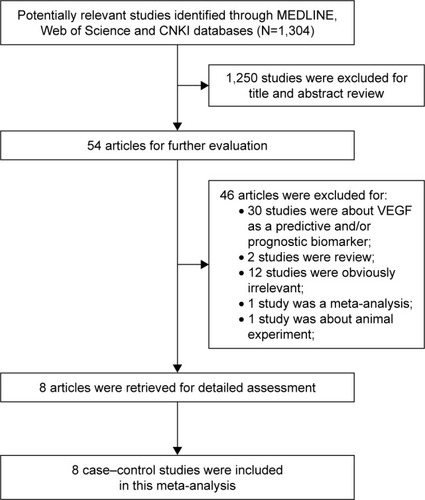
Table 1 Baseline characteristics of the included studies in the meta-analysis
Table 2 Meta-analysis results for the five studied polymorphisms and RCC risk
Figure 2 Forest plot of the association between the rs3025039(+936C/T) polymorphism and RCC risk in the allele contrast model (T vs C).
Abbreviations: RCC, renal cell carcinoma; CI, confidence interval.
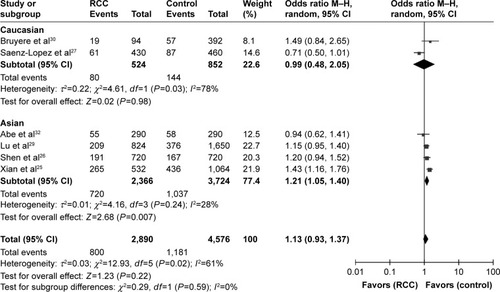
Figure 3 Forest plot of the association between the rs699947(−2578C/A) polymorphism and RCC risk in the allele contrast model (A vs C).
Abbreviations: RCC, renal cell carcinoma; CI, confidence interval.
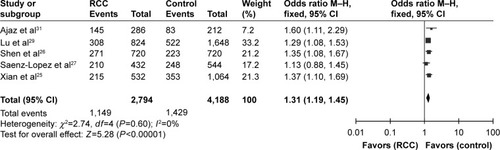
Figure 4 Forest plot of the association between the rs10434(+1612G/A) polymorphism and RCC risk in the homozygous model (GG vs AA).
Abbreviations: RCC, renal cell carcinoma; CI, confidence interval.
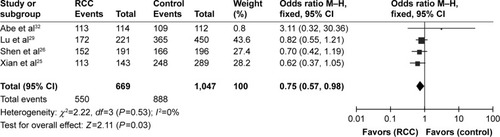
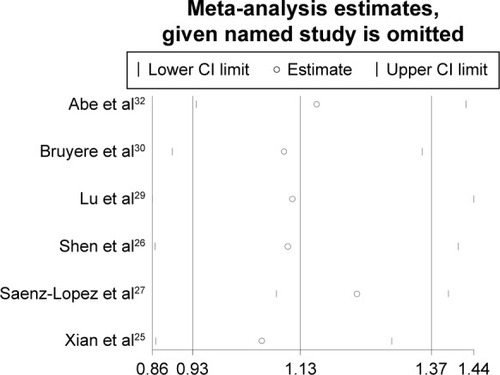
Figure 5 Sensitivity analysis for the associations between rs3025039(+936C/T) polymorphism and RCC risk.
Abbreviations: RCC, renal cell carcinoma; CI, confidence interval.