Figures & data
Figure 1 Influence of JX-GFP and TG6002±5-FU on SK29-MEL-1 cell viability.
Notes: The effects of JX-GFP and TG6002 on the viability were measured by MTT assay, and graphs show the percentage of living cells after virus infection vs untreated cell control (=100% viability). (A) Cells were treated with 5-FU for 5 d in a dilution period of 0.5 to 500 µg/mL; or cells were infected with JX-GFP with a MOI of 0.01 for 24 h and 5-FU was added for 5 d in a concentration of 0.5 to 500 µg/mL; or cells were infected with TG6002 with MOIs from 0.01 to 0.0001 for 24 h and 5-FU was added for 4 d or 5 d in a concentration of 0.5 to 500 µg/mL. (B) Cells were treated with 5-FU for 5 d in a dilution period of 0.5 to 500 µg/mL; or cells were infected with JX-GFP with a MOI of 0.01 for 48 h and 5-FU was added for 5 d in a concentration of 0.5 to 500 µg/mL; or cells were infected with TG6002 with MOIs from 0.01 to 0.0001 for 48 h and 5-FU was added for 4 d or 5 d in a concentration of 0.5 to 500 µg/mL. Data are shown for at least two independent experiments. *P≤0.05.
Abbreviations: 5-FU, 5-fluoruoracil; MTT, 3-(4,5-dimethylthiazol-2-yl)-2,5-diphenyltetrazoliumbromid; d, day; MOI, multiplicity of infection; h, hour.
Abbreviations: 5-FU, 5-fluoruoracil; MTT, 3-(4,5-dimethylthiazol-2-yl)-2,5-diphenyltetrazoliumbromid; d, day; MOI, multiplicity of infection; h, hour.
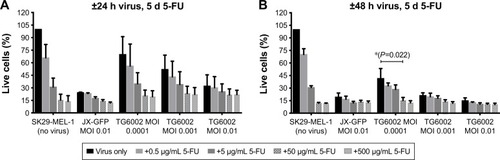
Figure 2 Influence of JX-GFP and TG6002±5-FC on SK29-MEL-1 cell viability.
Notes: The effects of JX-GFP and TG6002 on the viability were measured by MTT assay, and graphs show the percentage of living cells after virus infection vs untreated cell control (=100% viability). (A) Cells were treated with 5-FU for 5 d in a dilution period of 0.1 to 1,000 µg/mL; or cells were infected with JX-GFP with a MOI of 0.01 for 24 h and 5-FC was added for 5 d in a concentration of 0.1 to 1,000 µg/mL; or cells were infected with TG6002 with MOIs from 0.01 to 0.0001 for 24 h and 5-FC was added for 4 d or 5 d in a concentration of 0.1 to 1,000 µg/mL. (B) Cells were treated with 5-FC for 5 d in a dilution period of 0.1 to 1,000 µg/mL; or cells were infected with JX-GFP with a MOI of 0.01 for 48 h and 5-FC was added for 5 d in a concentration of 0.1 to 1,000 µg/mL; or cells were infected with TG6002 with MOIs from 0.01 to 0.0001 for 48 h and 5-FC was added for 4 d or 5 d in a concentration of 0.5 to 500 µg/mL. Data are shown for at least two independent experiments.
Abbreviations: 5-FC, 5-Fluorcytosin; MTT, 3-(4,5-dimethylthiazol-2-yl)-2,5-diphenyltetrazoliumbromid; d, day; MOI, multiplicity of infection; h, hour; ns, nonsignificant.
Abbreviations: 5-FC, 5-Fluorcytosin; MTT, 3-(4,5-dimethylthiazol-2-yl)-2,5-diphenyltetrazoliumbromid; d, day; MOI, multiplicity of infection; h, hour; ns, nonsignificant.
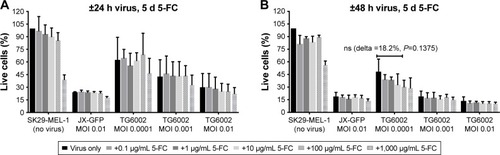
Figure 3 Type of cell death induced by viral oncolysis of JX-GFP and TG6002 in SK29-MEL-1.
Notes: Cell death was analyzed by flow cytometry. Cells were infected with JX-GFP or TG6002 using an MOI of 0.0001 and combined with 5 d of treatment with 100 µg/mL 5-FC or 50 µg/mL 5-FU. Cells were harvested and stained with Annexin V and propidium iodide and measured via flow cytometry. Data are shown for at least two independent experiments. (A) Overview of all cells. (B) Annexin V positive representing cells in early apoptosis. (C) Propidium iodide-positive cells representing cells undergoing necrosis. (D) Annexin V and propidium iodide-positive cells representing cells in late apoptosis. (E) Representative dot plots of untreated SK29-MEL-1 and TG6002 or JX-GFP-treated cells using quadrant gating. X-axis = propidium iodide (PI) and Y-axis = Annexin APC labeled.
Abbreviations: MOI, multiplicity of infection; d, day; 5-FC, 5-fluorcytosin; 5-FU, 5-fluoruoracil.
Abbreviations: MOI, multiplicity of infection; d, day; 5-FC, 5-fluorcytosin; 5-FU, 5-fluoruoracil.
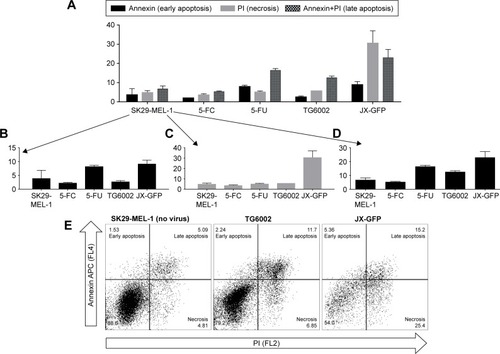
Figure 4 Immunogenic cell death markers were evaluated by ELISA and flow cytometry analysis.
Notes: (A) Supernatants of infected cells were collected after 7 d of treatment (48 h ± virus ±5 d of 5-FC or 5-FU) and stored in the refrigerator at −80°C until performing HMGB1-ELISA. HMGB1 concentration in supernatants after virally induced oncolysis and/or treatment with 5-FC, 5-FU or doxorubicin was measured via ELISA assay performed per protocol readout was done by ELISA microplate reader. (B) Adherent cells were detached after 7 d of treatment (48 h ± virus ±5 d of 5-FC or 5-FU), stained and analyzed by flow cytometry to detect calreticulin expression. Cells were stained simultaneously with Annexin V and PI. Graphs show percentage of calreticulin-expressing cells of the Annexin-positive and PI-negative cell population, respective cells in early apoptosis. *P≤0.05.
Abbreviations: ELISA, enzyme-linked immunosorbent assay; d, day; h, hour; 5-FC, 5-fluorcytosin; 5-FU, 5-fluoruoracil; HMGB1, high mobility group 1 protein; PI, propidium iodide; ns, nonsignificant.
Abbreviations: ELISA, enzyme-linked immunosorbent assay; d, day; h, hour; 5-FC, 5-fluorcytosin; 5-FU, 5-fluoruoracil; HMGB1, high mobility group 1 protein; PI, propidium iodide; ns, nonsignificant.
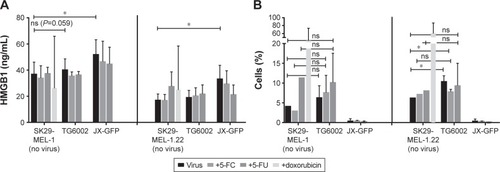
Figure 5 Coculture of virally and/or chemotherapy-induced TCLs with iDCs.
Notes: Flow cytometry analyses of maturation marker CD80, CD83 and CD86 were performed. Maturation of iDCs was driven by a cytokine cocktail. Thus, derived mature dendritic cells (mDCs) were as positive control. Virally and chemotherapy-induced TCLs were cocultivated with iDCs for 3 d. (A) Cells treated with 5-FC, 5-FU, TG6002, TG6002+5-FC or TG6002+5-FU. (B) Cells treated with 5-FC, 5-FU, JX-GFP or JX-GFP +5-FU. (C) Representative histograms from flow cytometry analysis. *P≤0.05; **P≤0.01; ***P≤0.001.
Abbreviations: TCL, tumor cell lysate; mDC, mature dendritic cells; iDCs, immature dendritic cells; d, day; 5-FC, 5-fluorcytosin; 5-FU, 5-fluoruoracil; ns, nonsignificant; APC, allophycocyanin; PE phycoerythrin.
Abbreviations: TCL, tumor cell lysate; mDC, mature dendritic cells; iDCs, immature dendritic cells; d, day; 5-FC, 5-fluorcytosin; 5-FU, 5-fluoruoracil; ns, nonsignificant; APC, allophycocyanin; PE phycoerythrin.
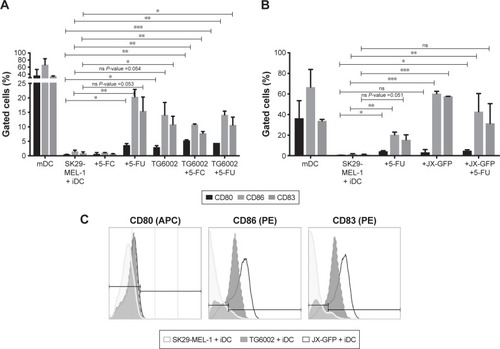
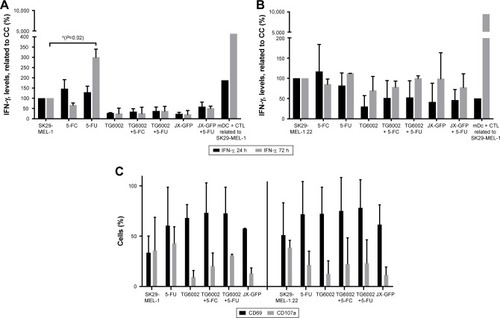
Figure 6 Activation of CTLs after coculture of virally or drug-induced TCLs with iDCs and CTLs for 24 and 72 h was analyzed by IFN-γ ELISA and flow cytometry.
Notes: (A) Activation of CTL was analyzed by IFN-γ ELISA. Data of cocultivation of SK29-MEL-1 melanoma cells are shown. (B) Activation of CTL was analyzed by IFN-γ ELISA. Data of cocultivation of HLA-loss clone SK29-MEL-1.22 melanoma cells are shown. (C) Cocultivation of virally or drug-induced TCLs with iDCs and CTLs was performed. Activation markers CD69 and CD107a were stained, and flow cytometry analyzes were performed. Left: coculture with SK29-MEL-1 melanoma cells and right: coculture with SK29-MEL-1.22 melanoma cell clone. *P≤0.05.
Abbreviations: h, hour; CC, cell control (untreated cells); CTLs, cytotoxic T lymphocytes; TCL, tumor cell lysates; IFN, interferon; ELISA, enzyme-linked immunosorbent assay; iDCs, immature dendritic cells; mDC, mature dendritic cells; 5-FU, 5-fluoruoracil; 5-FC, 5-fluorcytosin.
Abbreviations: h, hour; CC, cell control (untreated cells); CTLs, cytotoxic T lymphocytes; TCL, tumor cell lysates; IFN, interferon; ELISA, enzyme-linked immunosorbent assay; iDCs, immature dendritic cells; mDC, mature dendritic cells; 5-FU, 5-fluoruoracil; 5-FC, 5-fluorcytosin.