
Figures & data
Figure 1 Real-time polymerase chain reaction analysis of PLCE1 expression in 20 pairs of hepatocellular carcinomas and matched adjacent nontumorous tissues.
Abbreviations: mRNA, messenger RNA; PLCE1, phospholipase C epsilon-1.
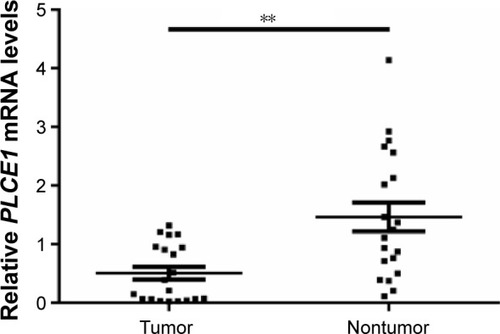
Figure 2 Western blotting analysis of PLCE1 expression in tissues from HCC tumorous tissues or cell lines and adjacent nontumorous tissues or normal liver epithelial cells.
Abbreviations: ANT, adjacent nontumorous tissues; HCC, hepatocellular carcinoma; PLCE1, phospholipase C epsilon-1.
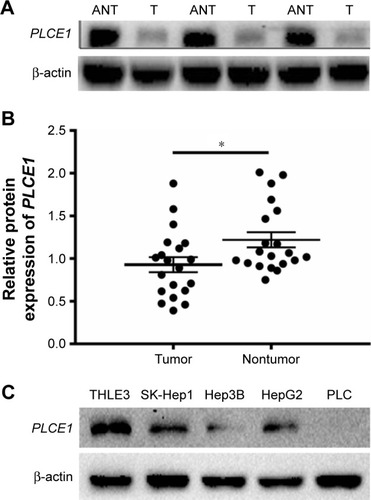
Figure 3 Representative immunohistochemical staining of PLCE1 in HCC and matched adjacent noncancerous liver tissues.
Abbreviations: HCC, hepatocellular carcinoma; PLCE1, phospholipase C epsilon-1.
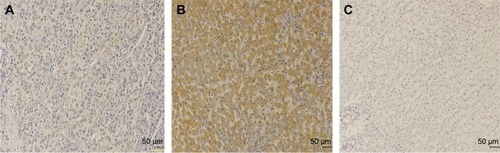
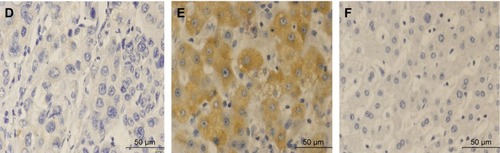
Table 1 Expression of PLCE1 in relation to clinicopathologic features
Figure 4 Kaplan–Meier analysis of OS and DFS curves of patients with HCC based on PLCE1 expression as positive or negative.
Abbreviations: DFS, disease-free survival; HCC, hepatocellular carcinoma; OS, overall survival; PLCE1, phospholipase C epsilon-1.
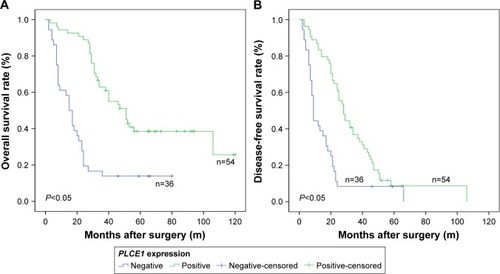
Table 2 Univariate analysis of parameters associated with OS and DFS
Table 3 Multivariate analysis of prognostic features associated with OS and DFS