Figures & data
Table 1 Primers used for real-time RT-PCR
Figure 1 Salinomycin repressed the proliferation of EOC cells.
Notes: (A and B) Salinomycin repressed the proliferation of A2780 and SK-OV-3 cells in a dose- and time-dependent manner. The bars indicate mean ± SD.
Abbreviations: EOC, epithelial ovarian cancer; SD, standard deviation.
Abbreviations: EOC, epithelial ovarian cancer; SD, standard deviation.
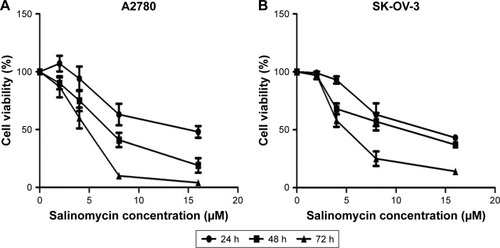
Figure 2 Salinomycin repressed the invasion and migration abilities of EOC cells.
Notes: (A and B) Images of A2780 and SK-OV-3 cells invading or migrating through the collagen membrane (×20 magnification). (C and D) Quantification of A2780 and SK-OV-3 cells invading or migrating through the collagen membrane. The analysis was normalized with the control group. The bars indicate mean ± SD. The significance of the difference was assessed by Student’s t-test. #P≤0.001.
Abbreviations: EOC, epithelial ovarian cancer; Ctr, control; Sal, salinomycin; SD, standard deviation.
Abbreviations: EOC, epithelial ovarian cancer; Ctr, control; Sal, salinomycin; SD, standard deviation.
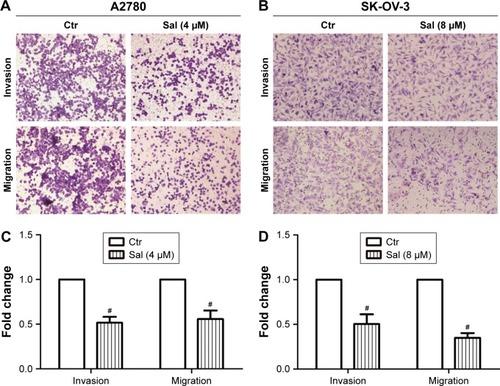
Figure 3 Salinomycin repressed the EMT program in EOC cells.
Notes: (A and B) Markers associated with EMT in A2780 and SK-OV-3 cells, respectively. (C and D) Semiquantification of Western blot bands is shown in A and B, respectively. The analysis was normalized with GAPDH. (E and F) RT-PCR analysis of E-cadherin and vimentin mRNA expression in A2780 and SK-OV-3 cells, respectively. GAPDH mRNA was used to normalize the variability. The bars indicate mean ± SD. The significance of the difference was assessed by Student’s t-test. *P≤0.05, &P≤0.01 and #P≤0.001.
Abbreviations: EMT, epithelial–mesenchymal transition; EOC, epithelial ovarian cancer; RT-PCR, reverse transcription polymerase chain reaction; Ctr, control; SD, standard deviation.
Abbreviations: EMT, epithelial–mesenchymal transition; EOC, epithelial ovarian cancer; RT-PCR, reverse transcription polymerase chain reaction; Ctr, control; SD, standard deviation.
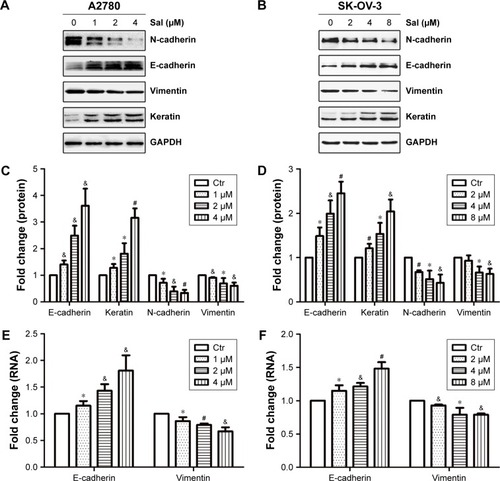
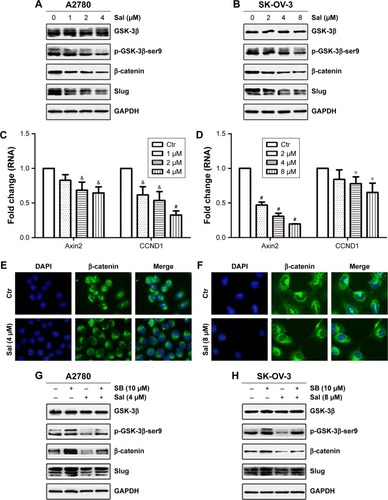
Figure 4 Salinomycin blocked the Wnt/β-catenin pathway in EOC cells.
Notes: (A and B) Markers associated with the Wnt/β-catenin pathway in A2780 and SK-OV-3 cells, respectively. (C and D) RT-PCR analysis of Axin2 and CCND1 mRNA expression in A2780 and SK-OV-3 cells, respectively. GAPDH mRNA was used to normalize the variability. (E and F) The distribution of β-catenin in A2780 and SK-OV-3 cells, respectively (×100 magnification). (G and H) The Wnt/β-catenin pathway associated molecules in EOC cells treated with DMSO vehicle, SB, salinomycin, salinomycin following SB treatment. The bars indicate mean ± SD. The significance of the difference was assessed by Student’s t-test. *P≤0.05, &P≤0.01 and #P≤0.001.
Abbreviations: EOC, epithelial ovarian cancer; RT-PCR, reverse transcription polymerase chain reaction; DMSO, dimethyl sulfoxide; Ctr, control; Sal, salinomycin; SB, SB216763; SD, standard deviation.
Abbreviations: EOC, epithelial ovarian cancer; RT-PCR, reverse transcription polymerase chain reaction; DMSO, dimethyl sulfoxide; Ctr, control; Sal, salinomycin; SB, SB216763; SD, standard deviation.