Figures & data
Figure 1 Flowchart of the study selection process.
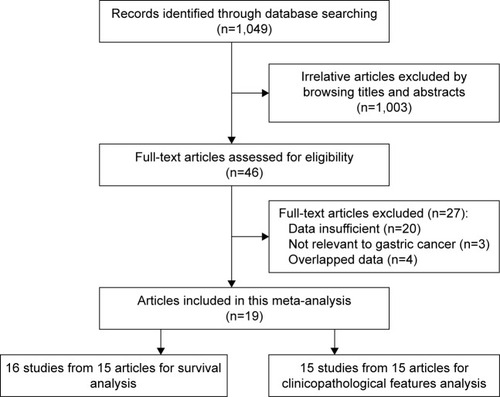
Table 1 Characteristics of studies included in the meta-analysis
Figure 2 Forest plot of HR for the association between proliferating cell nuclear antigen expression and overall survival in gastric cancer patients.
Abbreviations: CI, confidence interval; HR, hazard ratio.
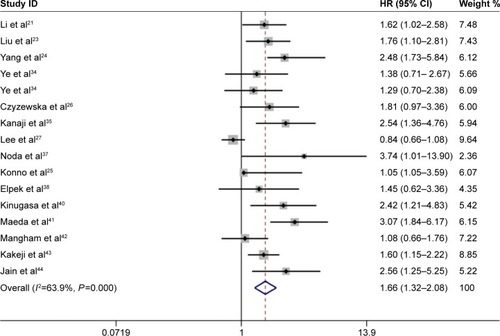
Table 2 Stratified analysis of PCNA expression with overall survival in gastric cancer patients
Figure 3 Forest plot of HR for the association between proliferating cell nuclear antigen expression and disease-free survival in gastric cancer patients.
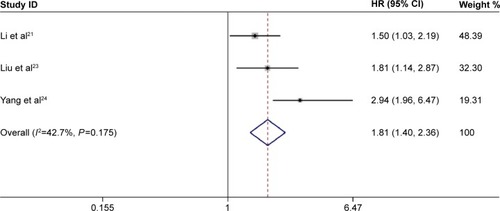
Table 3 Meta-analysis of PCNA high expression and clinicopathological features in gastric cancer
Figure 4 Sensitivity analysis of proliferating cell nuclear antigen expression on overall survival.
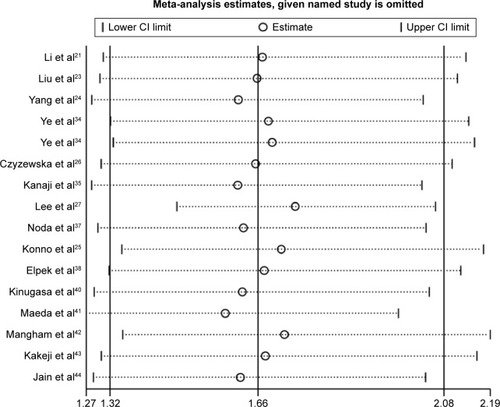
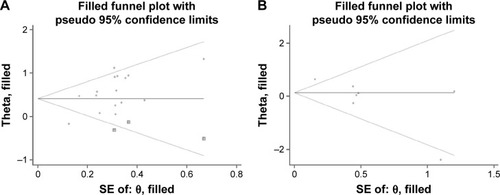
Figure 5 Funnel plots with trim-and-fill analysis for (A) overall survival and (B) Lauren classification.