Figures & data
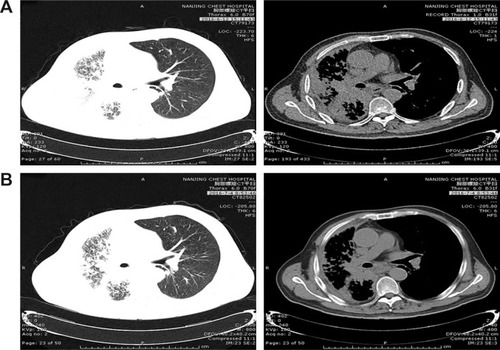
Figure 1 Patient I: Computed tomography shows the mass in the right lung with left lung metastasis and pleural effusion (A) before apatinib treatment and (B) after apatinib treatment was given for 2 weeks.
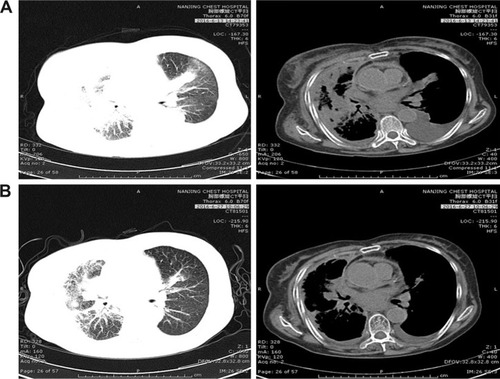
Table 1 Baseline characteristics of patients
Figure 2 Patient II: Computed tomography shows the mass in the right lung (A) before apatinib treatment and (B) after apatinib treatment was given for 1 month.
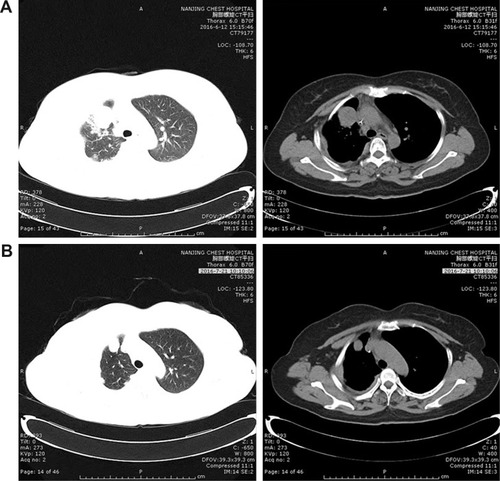
Figure 3 Patient III: Computed tomography shows the mass in the right lung (A) before apatinib treatment and (B) after apatinib treatment was given for 3 weeks.