Figures & data
Figure 1 The flow diagram of the included studies.
Abbreviation: NLR, neutrophil-to-lymphocyte ratio.
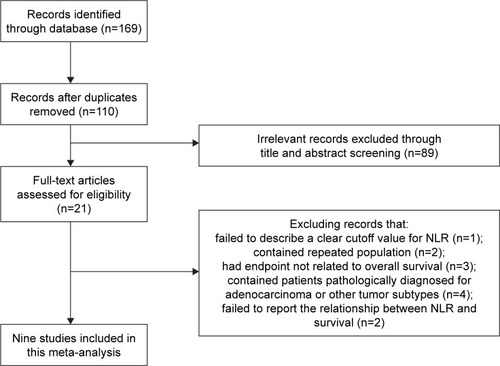
Table 1 Main characteristics of all the studies included in the meta-analysis
Figure 2 Meta-analysis of the association between NLR and OS in ESCC. Results are presented as individual and pooled HR, and 95% CI.
Abbreviations: NLR, neutrophil-to-lymphocyte ratio; OS, overall survival; ESCC, esophageal squamous cell carcinoma; HR, hazard ratio; CI, confidence interval; ES, effect size.
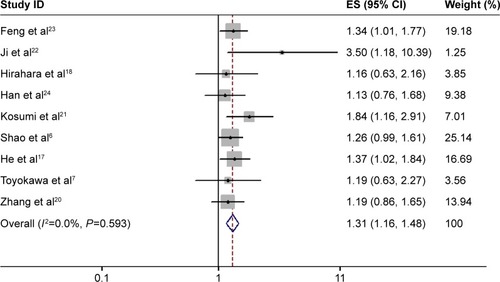
Table 2 Summary of the meta-analysis results
Table 3 Meta-analysis of the association between NLR and clinicopathologic features of ESCC
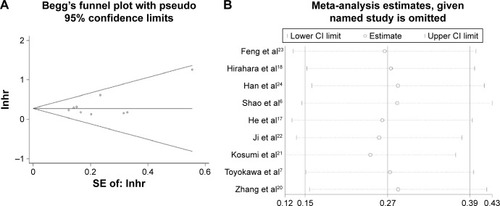
Figure 3 (A) Begg’s funnel plot for the assessment of potential publication bias. (B) Sensitivity analysis of the relationship between NLR and OS.
Abbreviations: NLR, neutrophil-to-lymphocyte ratio; OS, overall survival; SE, standard error; lnhr, natural logarithm of hazard ratio; CI, confidence interval.