Figures & data
Table 1 The primers used for RT-PCR
Figure 1 Difference of miR-98 and E2F1 expression levels in K562 and K562/A02 cells.
Notes: (A) Differences in the sensitivity to ADR in K562 and K562/A02 cells, IC50s were 0.33±0.11 µg/mL and 24.12±1.7 µg/mL, respectively. (B) Expression level differences of miR-98 in K562 and K562/A02 cells. (C) Expression level difference of E2F1 in K562 and K562/A02 cells. ***P<0.001.
Abbreviations: ADR, Adriamycin; IC50, median inhibitory concentration.
Abbreviations: ADR, Adriamycin; IC50, median inhibitory concentration.
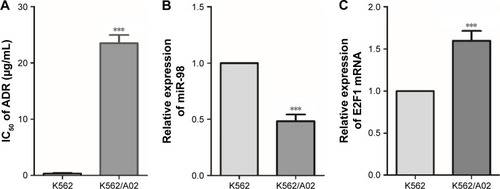
Figure 2 Expression level changes of miR-98 and E2F1 after K562/A02 cells were transfected with miR-98 mimic.
Notes: (A) TargetScan showed that E2F1 was one of the downstream target genes of miR-98. (B) Expression level of miR-98 was significantly increased after transfection with miR-98 mimic. (C) After transfection with miR-98 mimic, the E2F1 expression level was decreased. *P<0.05; ***P<0.001.
Abbreviations: NC, negative; UN, untreated.
Abbreviations: NC, negative; UN, untreated.
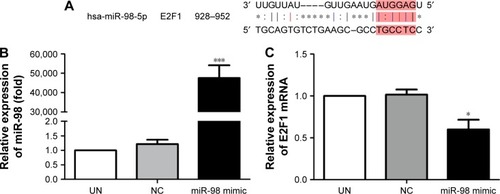
Figure 3 Expression level change of E2F1 protein after K562/A02 cells were transfected with miR-98 mimic.
Notes: (A) Difference of ABCG2 and E2F1 protein expression levels in K562 and K562/A02 cells. (B) E2F1 protein expression level was significantly decreased after transfection.
Abbreviations: GAPDH, glyceraldehyde 3-phosphate dehydrogenase; NC, negative; UN, untreated.
Abbreviations: GAPDH, glyceraldehyde 3-phosphate dehydrogenase; NC, negative; UN, untreated.
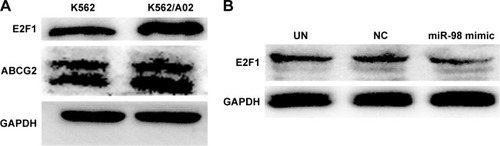
Figure 4 Influence of transfection with miR-98 mimic on proliferation and IC50 in K562/A02 cells.
Notes: Compared with the control group, no significant difference on days 1 and 2 post transfection was observed; the proliferation was decreased on days 3 and 4 (A). After K562/A02 cells were transfected by miR-98 mimic, the sensitivity to ADR was significantly increased, and IC50 was 12.19±1.78 µg/mL (B). *P<0.05.
Abbreviations: ADR, Adriamycin; IC50, median inhibitory concentration; OD, optical density; NC, negative; UN, untreated.
Abbreviations: ADR, Adriamycin; IC50, median inhibitory concentration; OD, optical density; NC, negative; UN, untreated.
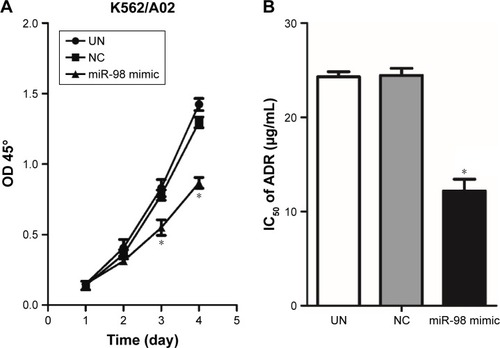
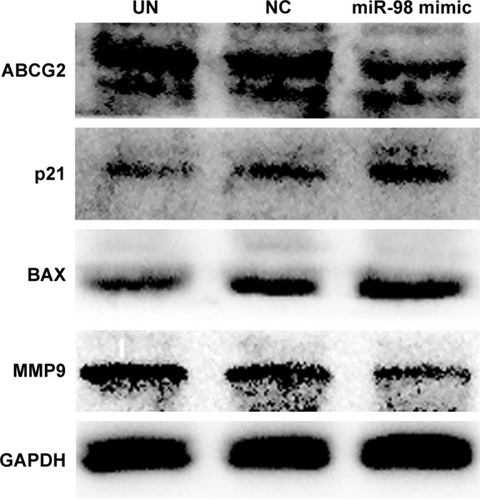
Figure 5 Intracellular expression level changes of ABCG2, MMP9, p21, and BAX after K562/A02 cells were transfected with miR-98 mimic.
Abbreviations: GAPDH, glyceraldehyde 3-phosphate dehydrogenase; MMP9, matrix metalloproteinase 9; NC, negative; UN, untreated.