Figures & data
Table 1 List of primers and their applications
Figure 1 LET expression in NPC tissues and cell lines. (A) The expression level of LET in 95 pairs of NPC tissues and pair-matched adjacent normal tissues was measured by qRT-PCR. (B) The expression level of LET in normal nasopharyngeal epithelial cell line NP69 and NPC cell lines CNE1, CNE2, SUNE1, HNE1, HONE1 and C666-1 was analyzed by qRT-PCR. Data were obtained for at least three independent experiments and are shown as mean ± SD (**P<0.01 and ***P<0.001 as compared with control group).
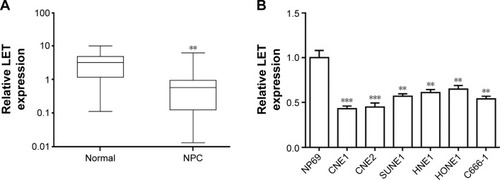
Figure 2 Effects of LET expression on cell proliferation of CNE2 cells. (A) The interference effect of LET in CNE2 cell lines. The cells were transfected with si-LET, and the decreased expression of LET was measured using qRT-PCR. (B) The LET expression levels after overexpression in CNE2 cells. The cells were transfected with the LET expression vector (pcDNA3.1-LET) or control vector into CNE2 cells, and the increased expression of LET was measured using qRT-PCR. (C and D) Cell viability was measured using the MTT assay. CNE2 cells were transfected with pcDNA3.1-LET or si-LET for 24, 48 and 72 h and then were collected for assays. (E) The protein level of proliferation-related genes in CNE2 cells transfected with pcDNA3.1-LET or si-LET was detected using Western blot. In these experiments, the original cells and the cells transfected with pcDNA3.1 or si-Ctrl were adopted as control and negative control, respectively. Data were obtained for at least three independent experiments and are shown as mean ± SD (*P<0.05, **P<0.01 and ***P<0.001 as compared with control group).
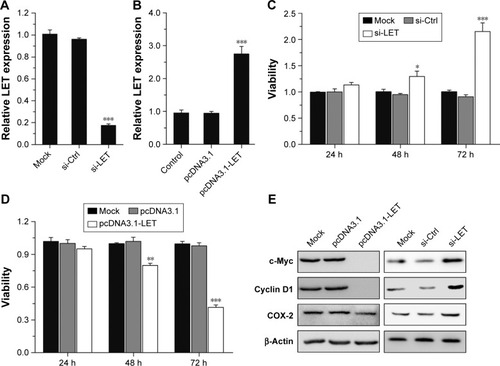
Figure 3 Effects of LET on cell cycle of CNE2 cells. (A) CNE2 cells transfected with pcDNA3.1-LET were collected and stained with PI, and the cell cycle distribution was analyzed with a flow cytometer. (B) CNE2 cells transfected with si-LET were collected and stained with PI, and the cell cycle distribution was analyzed with a flow cytometer. (C) The protein expression of cell cycle-related gene in CNE2 cells was analyzed by Western blot assays. β-Actin was used as the internal reference. (D) The mRNA expression of cell cycle-related gene in CNE2 cells was analyzed by qRT-PCR assays. In these experiments, the original cells and the cells transfected with pcDNA3.1 or si-Ctrl were adopted as control and negative control, respectively. Data were obtained for at least three independent experiments and are shown as mean ± SD (*P<0.05, **P<0.01 and ***P<0.001 as compared with control group).
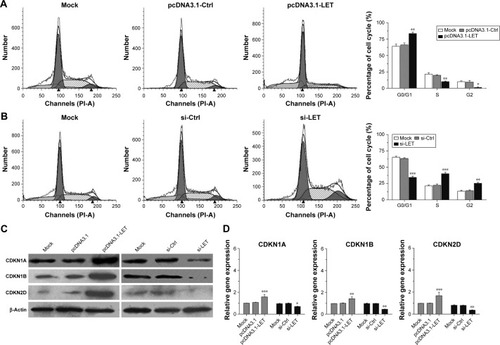
Figure 4 Effects of LET on cell adhesion and invasion of CNE2 cells. (A) CNE2 cells were transfected with pcDNA3.1-LET or si-LET, and then subjected to analyzes for cell–matrix adhesion. (B) The invasiveness of CNE2 cells transfected with pcDNA3.1-LET or si-LET was measured by transwell assay. Magnification ×200. (C) The protein expression level change of cell invasion-related gene in CNE2 cells was analyzed by Western blot assays. β-Actin was used as the internal reference. (D) The mRNA expression level change of cell invasion-related gene in CNE2 cells was analyzed by qRT-PCR assays. In these experiments, the original cells and the cells transfected with pcDNA3.1 or si-Ctrl were adopted as control and negative control, respectively. Data were obtained for at least three independent experiments and are shown as mean ± SD (*P<0.05, **P<0.01 and ***P<0.001 as compared with control group).
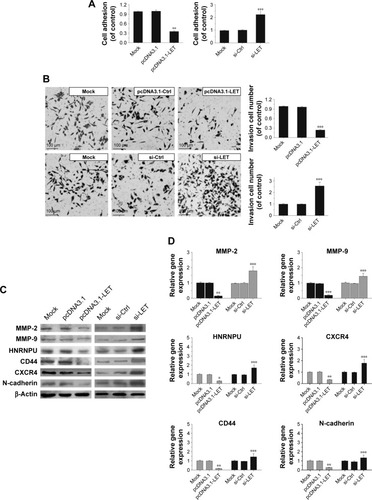
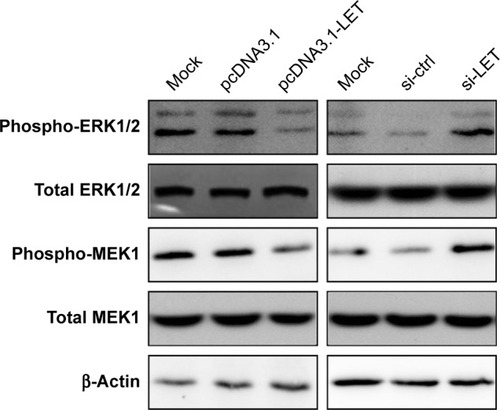
Figure 5 The phosphorylation status of ERK1/2 and MEK1 of CNE2 cells. CNE2 cells were transfected with pcDNA3.1-LET or si-LET, and the phosphorylation and total status of ERK1/2 and MEK1 were analyzed by Western blot.