Figures & data
Figure 1 From left to right are HCT-116 cells in the logarithmic growth phase at 800× magnification, stable HCT-116 cell lines expressing GFP at 800× magnification, and the BALB/c nu/nu mouse implanted with HCT-116 cells expressing GFP by subcutaneous injection into the iliac region.
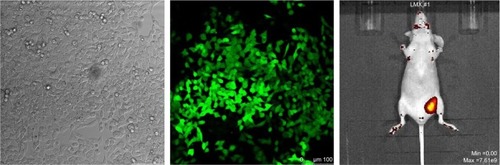
Figure 2 From left to right are the coronal, axial T2WI, and DWI images using 10 b values of 0, 10, 20, 50, 100, 200, 400, 600, 800, 1,000, 1,200, and 1,500 s/mm2.
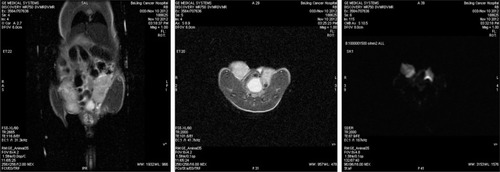
Figure 3 ROI was drawn on the b0 image with a homogenous area of tumor, consistent with minimal contamination from unintended tissues; moreover, signal intensities were measured for each b value with a copy–paste operation.
Abbreviation: ROI, region of interest.
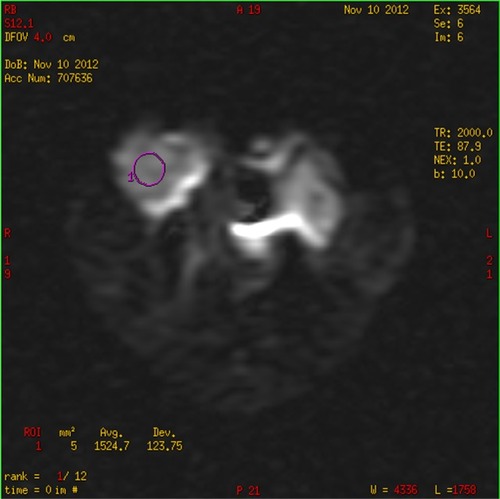
Figure 4 Time-dependent dynamic changes of DWI parameters and photon numbers between radiotherapy and control groups. (A) D_max, (B) FWHM, (C) ADC, and (D) photon numbers.
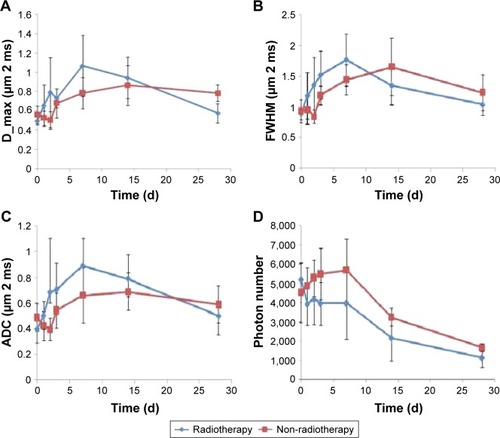
Table 1 Comparisons of percentage changes of DWI and optical parameters between radiotherapy and control groups
Figure 5 The change of pathological indices between radiotherapy and control groups at different time points. (A) Ki67, (B) cyclin D1, and (C) survivin.
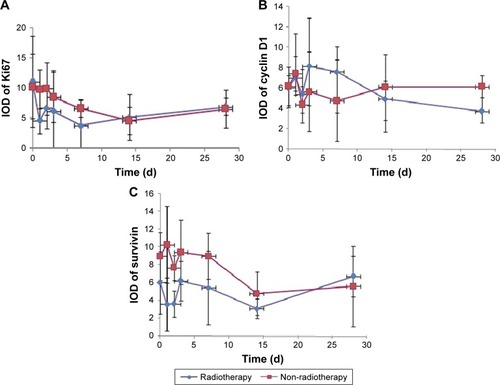
Figure 6 Histopathologic comparisons between radiotherapy and control groups using slides at 400× magnification. Scale bar: 50 μm. (A) 24 h cyclin D1 expression in the control group; (B) 24 h cyclin D1 expression in the radiotherapy group; (C) 24 h survivin expression in the control group; (D) 24 h suivivin expression in the radiotherapy group; (E) 24 h Ki67 expression in the control group; and (F) 24 h Ki67 expression in the radiotherapy group.
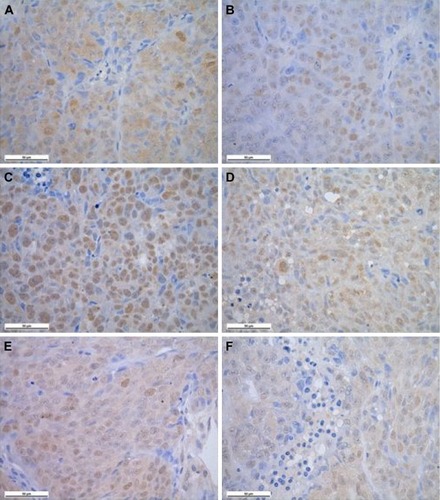
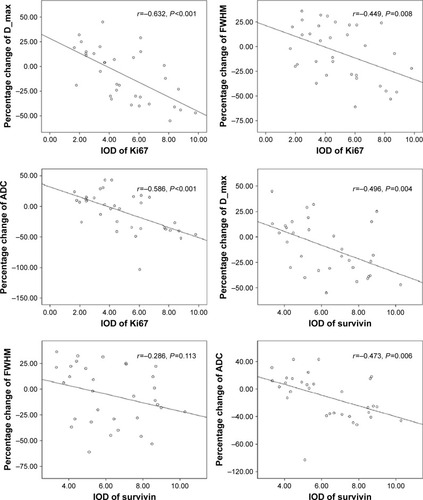
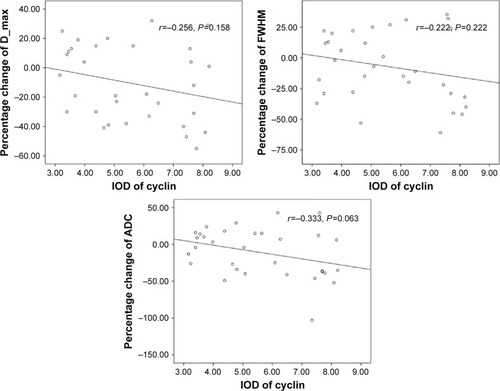
Figure 7 Correlations between pathological indexes (Ki67, survivin and cyclin D1) and percentage changes of DWI parameters (D_max, FWHM, and ADC values).