Figures & data
Figure 1 Images of HJURP immunohistochemistry staining. (A) Low HJURP expression and (B) high HJURP expression. Scale bar: 50 μm.
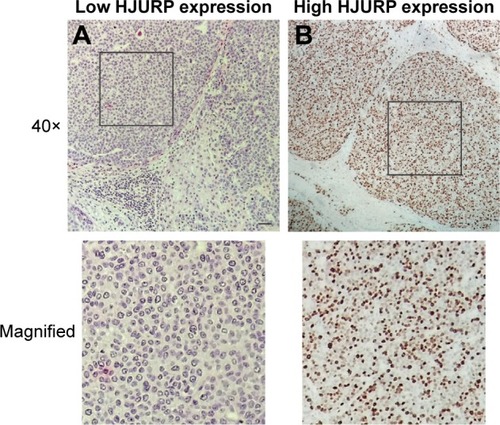
Table 1 Correlation between HJURP and clinicopatholgical factors
Figure 2 Correlation between HJURP expression and the overall survival rate. Survival curves representing low and high HJURP expressions were displayed by Kaplan–Meier method and statistical significance was analyzed by log-rank test (P=0.003).
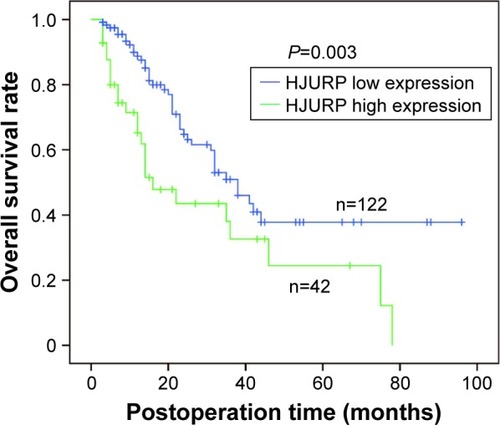
Table 2 Univariate analysis
Table 3 Multivariate analysis
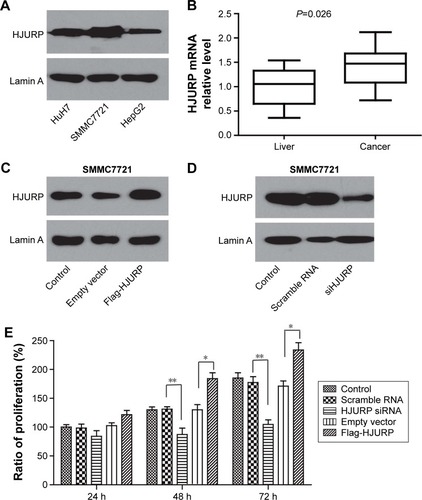
Figure 3 HJURP promotes HCC cell line proliferation. (A) HJURP expression in HCC cell line HuH7, SMMC7721, and HepG2 was detected by Western blotting. (B) HJURP mRNA level in HCC tissues was significantly higher than that of the corresponding normal liver tissues (P=0.026). (C) Successful HJURP overexpression in SMMC7721 was verified by Western blotting. HJURP was cloned into pFLAG-CMV2 by double digestion with restriction enzymes and transfected into SMMC7721. HJURP expression 48 h after transfection was detected by Western blotting. (D) Successful HJURP knockdown in SMMC7721 was verified by Western blotting. HJURP knockdown was performed by siRNA. HJURP expression 48 h after siRNA transfection was detected by Western blotting. (E) Cell proliferation was detected by MTT assay in SMMC7721 cell line after regulating HJURP expression. After 24 h of transfection with scrambled RNA, siRNA, control vector, or Flag-HJURP vector, cells were passaged into 96-well plates and starved for 6 h. Then medium containing 10% FBS was added, which was set as time 0. Cell proliferation at time point 24, 48, or 72 h after time 0 was detected. The proliferation ratio of group without any treatment (control group) at 24 h was set as 100% and other groups were standardized with this baseline. Column graph was displayed with ± SEM. *P<0.05 and **P<0.01.