
Figures & data
Table 1 Associations between invasion types and clinicopathological characteristics of 296 patients with gastric adenocarcinoma
Figure 1 Microscopic observations for gastric adenocarcinoma (HE stain).
Notes: (A) Tumor budding (arrows) was defined as a cluster of tumor cells composed of fewer than five tumor cells and was evaluated at 100× magnification. (B) Tumor budding (arrows) evaluated at 400× magnification. (C) Single cell invasion indicated by arrows at 400× magnification. (D) Large cell invasion was defined as a tumor cell whose nucleus diameter was quadruple the size of a small nearby lymphocyte. Indicated by arrows at 400× magnification. (E) Mitosis indicated by arrows at 400× magnification. (F) Fibrosis was confirmed if the area of fibrosis was >60% of the microscopic field. Evaluated at 100× magnification.
Abbreviation: HE, hematoxylin and eosin.
Abbreviation: HE, hematoxylin and eosin.
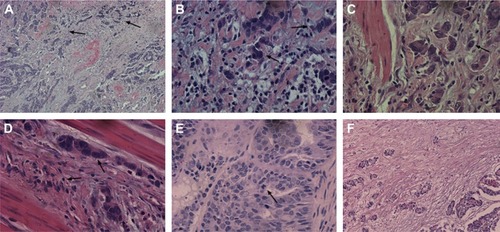
Figure 2 Overall survival (OS) figures pertaining to tumor budding (A), single cell invasion (B), large cell invasion (C), and mitotic count (D) in gastric adenocarcinoma.
Notes: (A) Kaplan–Meier survival curve for tumor budding in patients with gastric adenocarcinoma. The OS of cases with high-grade tumor budding was shorter than for cases exhibiting low-grade budding (P<0.001). (B) Patients with single cell invasion had shorter OS compared to those without single cell invasion (P<0.001). (C) Patients with large cell invasion had shorter OS compared to those without large cell invasion (P<0.001). (D) Patients with high mitotic count had shorter OS compared to those without high mitotic count (P=0.035).
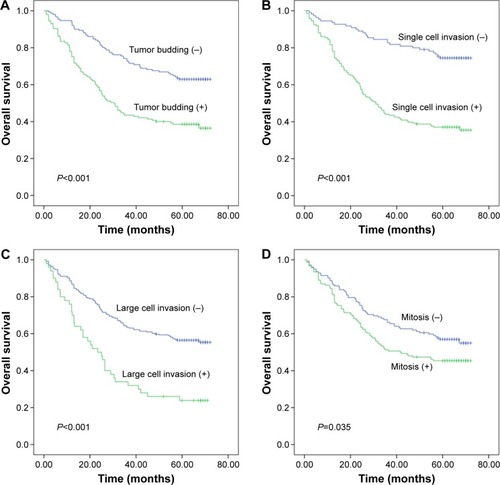
Figure 3 Survival curves according to different classification systems in gastric adenocarcinoma.
Notes: (A) Kaplan–Meier survival curve of WHO classification in patients with gastric adenocarcinoma. Papillary carcinoma showed statistically significant differences with tubular carcinoma subtype (P=0.001) but not with other subtypes (mucinous carcinoma, P=0.628; signet ring cell carcinoma, P=0.353; low-differentiated carcinoma, P=0.550; and undifferentiated carcinoma, P=0.528). P, T, M, S, L, and U represent papillary carcinoma, tubular carcinoma, mucinous carcinoma, signet ring cell carcinoma, minimally differentiated carcinoma, and undifferentiated carcinoma, respectively. (B) According to the Lauren classification, diffuse-type patients have unfavorable prognosis (P<0.001). I and D represent intestinal-type and diffuse-type gastric adenocarcinoma, respectively. (C) According to the Gosrki classification, the well-differentiated grades I and II had higher survival rates than the poorly differentiated grades III and IV. Grade I showed statistically significant differences compared with grades II, III, and IV (P=0.023, P<0.001, and P=0.002). I: well-differentiated and mucin-poor areas of tumor. II: well-differentiated and mucin-rich parts of the tumor. III: poorly differentiated and mucin-poor parts of the tumor. IV: poorly differentiated and mucin-rich parts of the tumor. (D) According to the new pathological classification, grade I showed statistically significant difference from grades II, III, and IV (P=0.001, P<0.001, and P<0.001). I: patients without tumor budding, single cell invasion, and large cell invasion. II: patients with single cell invasion. III: patients with tumor budding and single cell invasion. IV: patients with tumor budding, single cell invasion, and large cell invasion.
Abbreviation: WHO, World Health Organization.
Abbreviation: WHO, World Health Organization.
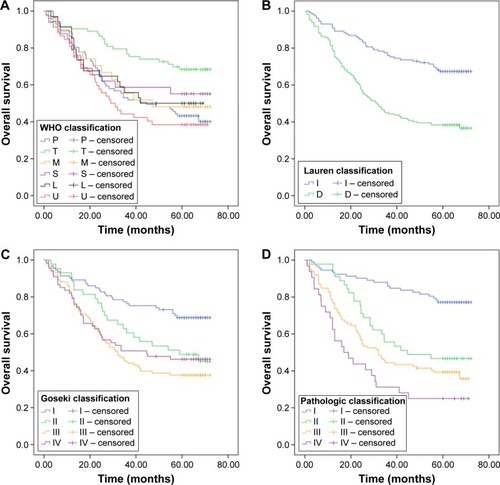
Table 2 Univariate Cox regression analysis of clinical and pathological characteristics
Table 3 Multivariate Cox regression analysis of clinical and pathological characteristics