Figures & data
Figure 1 Skin lesion score according to the Eruption Score System.
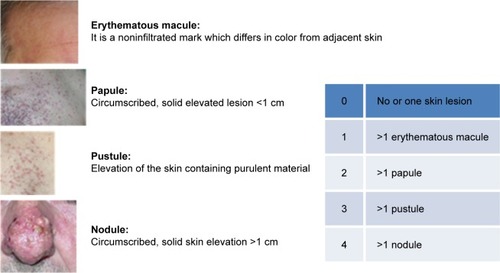
Table 1 Baseline demographic and clinical characteristics of patients enrolled in the study
Figure 2 Correlation between QoL evaluated with the Skindex-29 and severity of cutaneous toxicity assessed using NCI-CTCAE v4.0 and ESS systems.
Abbreviations: ESS, Eruption Scoring System; NCI-CTCAE, National Cancer Institute’s Common Terminology Criteria for adverse events; QoL, quality of life.
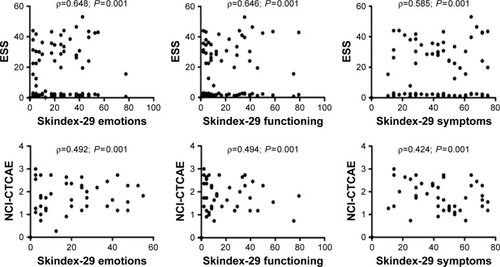
Figure 3 Correlation between QoL evaluated with the Skindex-17 and severity of cutaneous toxicity assessed using NCI-CTCAE v4.0 and ESS systems.
Abbreviations: ESS, Eruption Scoring System; NCI-CTCAE, National Cancer Institute’s Common Terminology Criteria for adverse events; QoL, quality of life.
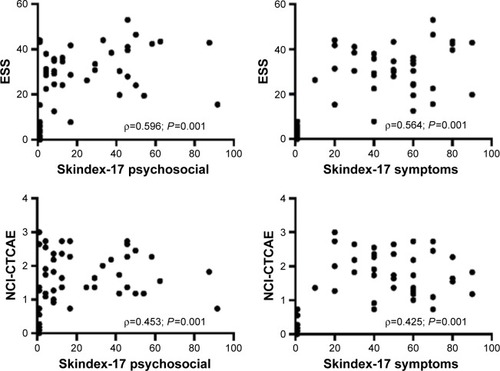
Table 2 Median and IQR of each observer for NCI-CTCAE v4.0 and ESS
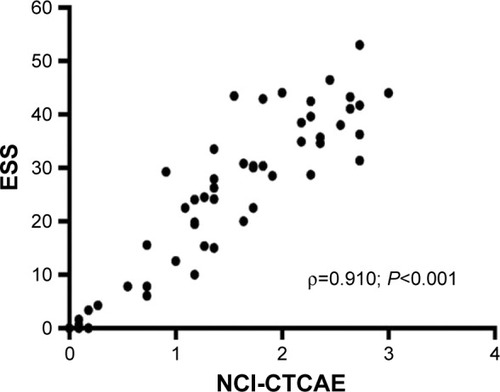
Figure 4 Correlation between NCI-CTCAE v4.0 and ESS.
Abbreviations: ESS, Eruption Scoring System; NCI-CTCAE, National Cancer Institute’s Common Terminology Criteria for Adverse Events.