
Figures & data
Figure 1 Flow diagram of the study patients with PanNETs.
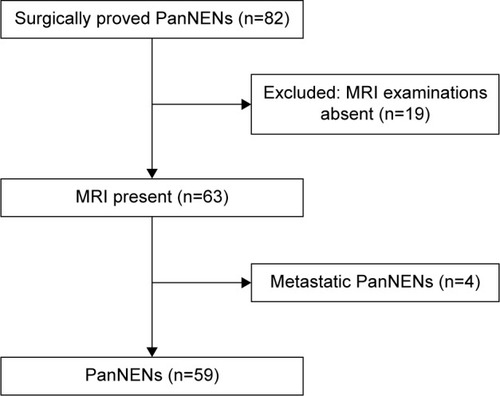
Table 1 Clinical data of patients
Figure 2 A 65-year-old female with a pathologically proven, grade 1 neuroendocrine tumor in the pancreatic head.
Abbreviation: ADC, apparent diffusion coefficient.
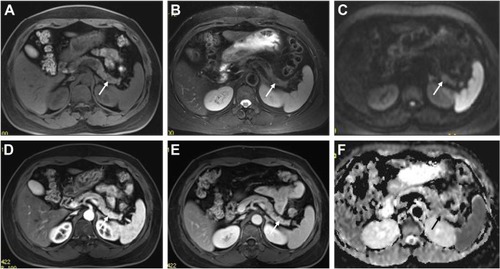
Figure 3 A 48-year-old male with a pathologically proven, grade 2 neuroendocrine tumor in the pancreatic tail.
Abbreviation: ADC, apparent diffusion coefficient.
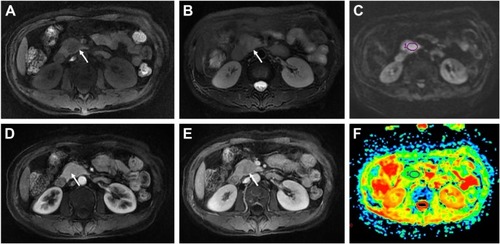
Figure 4 A 32-year-old male with a pathologically proven, grade 3 neuroendocrine carcinoma in the pancreatic head.
Abbreviation: ADC, apparent diffusion coefficient.
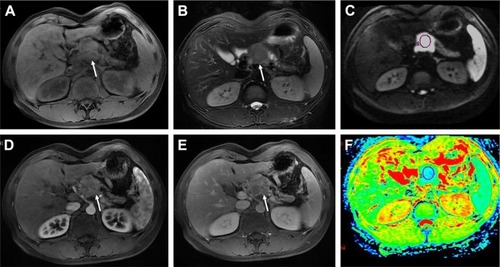
Figure 5 ADC values of normal pancreatic parenchyma, PanNETs G1/G2 and PanNEC G3.
Abbreviations: ADC, apparent diffusion coefficient; PanNETs G1/G2, grade 1/2 pancreatic neuroendocrine tumors; PanNEC G3, pancreatic neuroendocrine carcinoma G3.
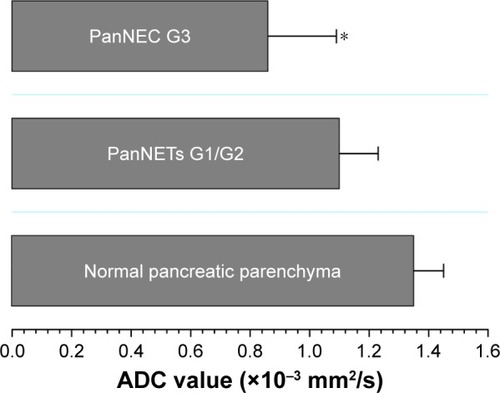
Table 2 The summary of MRI findings
Figure 6 ROC curves of the mean ADC value and tumor size for differentiating PanNETs G1/G2 from PanNEC G3.
Abbreviations: ROC, receiver operating characteristic; ADC, apparent diffusion coefficient; PanNETs, pancreatic neuroendocrine tumors; PanNEC G3, pancreatic neuroendocrine carcinoma G3.
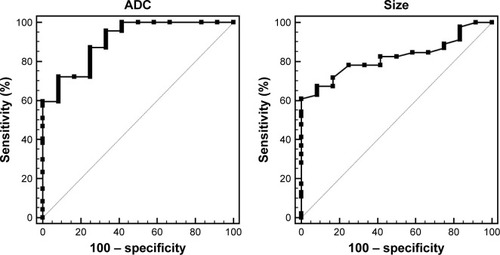
Table 3 Sensitivity and specificity of MR findings and ADC value for differentiating grade 3 from grade 1/2 pancreatic neuroendocrine tumors
Table 4 Correlation analysis between MRI findings and histological features
Table 5 ORs for the associations between MRI findings and PanNEN grade (G3 vs GI/G2)