
Figures & data
Table 1 Characteristics of patients and clinical parameters
Table 2 Results of late toxicity and cosmesis at mean 6-year follow-up
Figure 1 The NTCP model for late tissue predicts the double-trouble (according to higher fraction size) and triple-trouble (according to high total dose) effects for hotspots >10% of PD (blue dotted line) and for hotspots >20% of PD (pink dotted line). *The formula refers to Lyman’s modelCitation18 but the original data from this study has been applied.
Abbreviations: NTCP, normal tissue complication probability; PD, prescribed dose; PTV, planning target volume; BED, biologically effective dose.
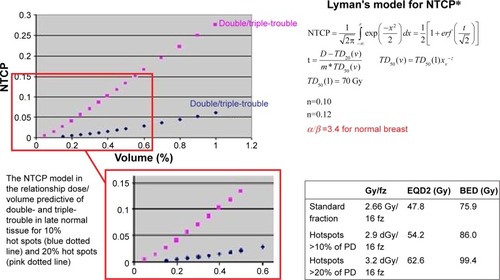
Table 3 Univariate analysis (χ2) for relation of late toxicity and cosmesis
Table 4 Univariate analysis (paired t-test)
Figure 2 Forest plot for multivariate analysis.
Notes: Correlation between variables and toxicity: diamonds over the green line represent as strong correlation; diamond before the yellow line represents as weak correlation; and diamond on the red line represents no correlation.
Abbreviations: PTV, planning target volume; G, grade; V110, volume of the PTV breast taking 110% of the prescribed dose; CT, chemotherapy.
Abbreviations: PTV, planning target volume; G, grade; V110, volume of the PTV breast taking 110% of the prescribed dose; CT, chemotherapy.
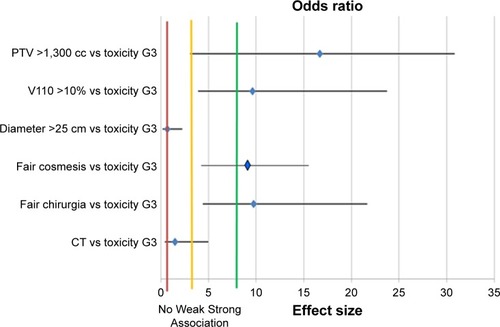
Table 5 Pearson’s covariance for multivariate analysis