
Figures & data
Table 1 Characteristics of patients with hepatocellular cell carcinoma from the TCGA data portal
Figure 1 Volcano plot showing the distribution of genes from the promoter-level test assessed by methylation differences and adjusted P-values.
Abbreviation: FDR, false discovery rate.
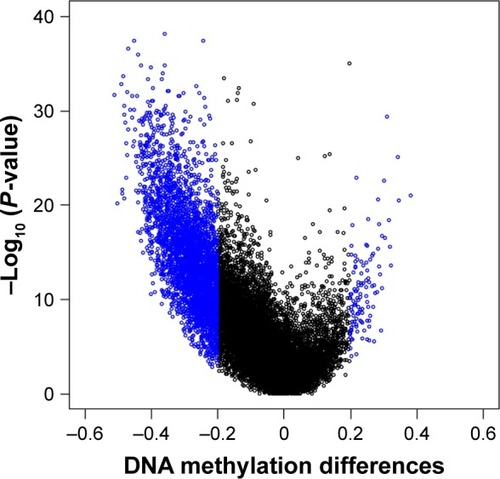
Figure 2 Heatmap of differentially methylated genes within promoters between HCC cancer tissues and adjacent tissues.
Abbreviations: FDR, false discovery rate; HCC, hepatocellular carcinoma.
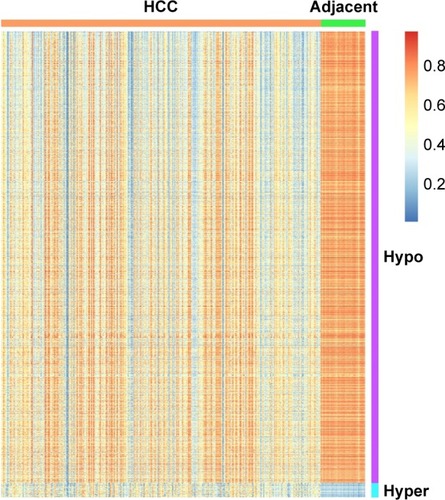
Table 2 Univariate and multivariate analysis of prognostic variables for cancer-specific survival in patients with hepatocellular cell carcinoma
Figure 3 Kaplan–Meier plot of overall survival.
Abbreviations: HCC, hepatocellular carcinoma; IL21, interleukin-21; RNA5SP38, RNA 5S ribosomal pseudogene 38; SDC4P, syndecan 4 pseudogene.
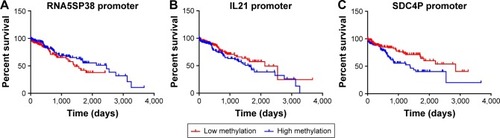
Figure 4 The areas under the ROC curves for the three gene promoter methylations and their combination that differentiate between HCCs and adjacent tissues.
Abbreviations: AUC, area under the curve; HCC, hepatocellular carcinoma; IL21, interleukin-21; RNA5SP38, RNA 5S ribosomal pseudogene 38; ROC, receiver operating characteristic; SDC4P, syndecan 4 pseudogene.
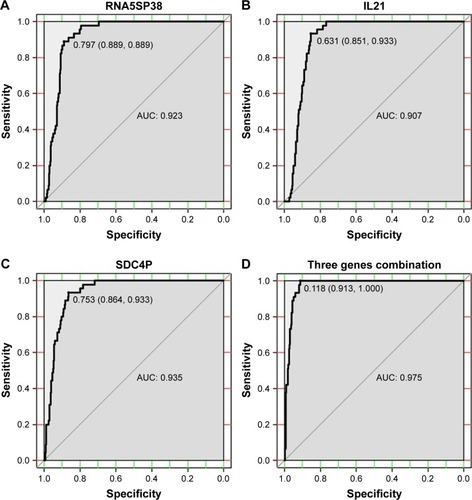
Table 3 KEGG and PANTHER pathways enriched in differentially methylated genes within promoters