
Figures & data
Figure 1 Expression of GRHL2, HIF-1α, and VEGF in esophageal cancer tissues. (A, D, and G) Negative expression of GRHL2, HIF-1α, and VEGF. (B, E, and H) Weak positive expression of the three proteins. (C, F, and I) Positive expression of the three proteins. The scale bars are 100 μm and the magnification is ×200.
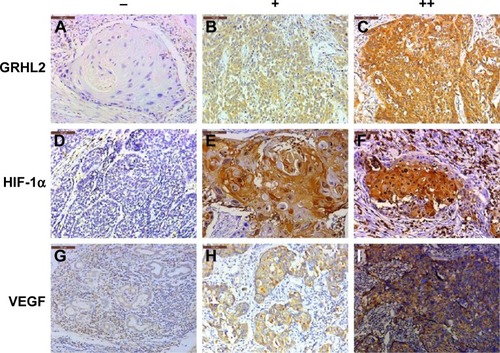
Table 1 Expression of GRHL2, HIF-1α, and VEGF in EC tissue and the corresponding adjacent normal tissues
Figure 2 Correlation between GRHL2, HIF-1α, and VEGF and MVD. (A) Expression of CD34 analyzed by immunohistochemical analysis. (B) Relative level of MVD in low and high GRHL2 expression groups. (C) Relative level of MVD in low and high HIF-1α expression groups. (D) Relative level of MVD in low and high VEGF expression groups. *P<0.05, compared with adjacent tissues. (A) Magnification left image: ×100; right image: ×200.
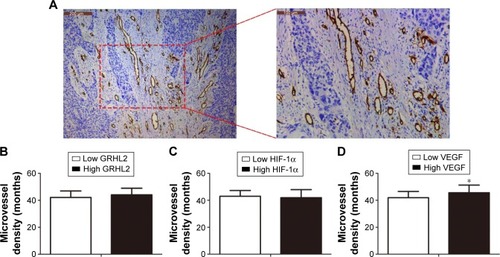
Table 2 Correlation between the clinicopathological features and the expression of GRHL2, HIF-1α, and VEGF in EC
Figure 3 Kaplan–Meier survival analysis of GRHL2 and HIF-1α expression in esophageal cancer tissues. Low GRHL2 and high HIF-1α expression was correlated with (A) inferior recurrence-free survival and (B) overall survival in esophageal cancer patients.
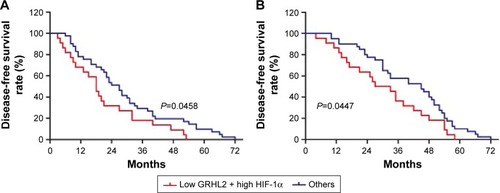
Table 3 Correlation between GRHL2, HIF-1α, and VEGF in EC