Figures & data
Figure 1 Flow cytometry analysis of the salvage pathway enzymes in H460 cells.
Abbreviations: APRT, adenine phosphoribosyltransferase; DCK, deoxycytidine kinase; HPRT, hypoxanthine guanine phosphoribosyltransferase.
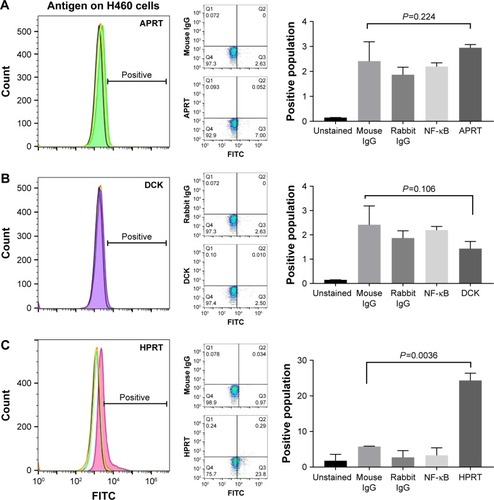
Figure 2 HPRT surface expression on A549 non-small-cell lung cancer cells.
Abbreviations: APRT, adenine phosphoribosyltransferase; DCK, deoxycytidine kinase; HPRT, hypoxanthine guanine phosphoribosyltransferase.
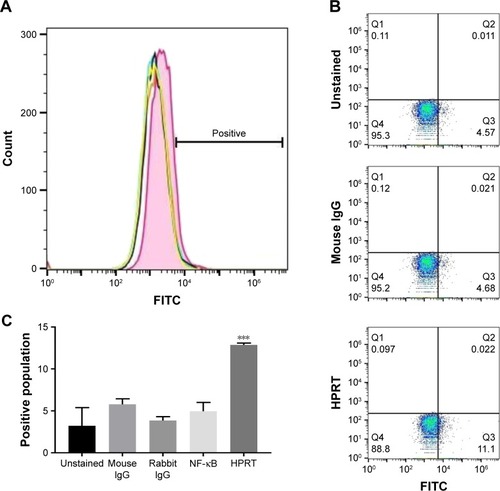
Figure 3 Levels of HPRT expression compared between A549 and H460 cells. Notes: While both A549 and H460 cells show a statistically significant increase in the surface expression of HPRT, H460 cells had a significantly higher expression (P<0.0001). H460 cells are a faster growing cell line, with a growth rate almost double that of A549 cells. As a result, HPRT expression on the surface of non-small-cell lung cancer cells may directly correspond to cell proliferation. ****P<0.0001.
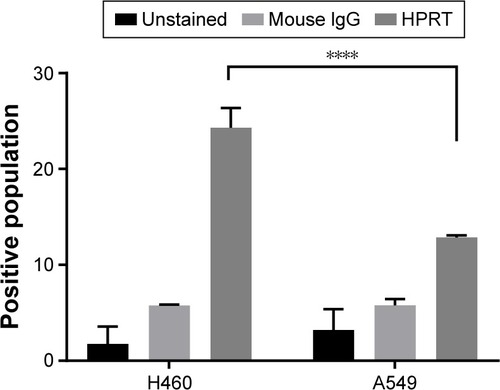
Figure 4 Plasma membrane colocalization with HPRT in H460 cells.
Abbreviation: HPRT, hypoxanthine guanine phosphoribosyltransferase.
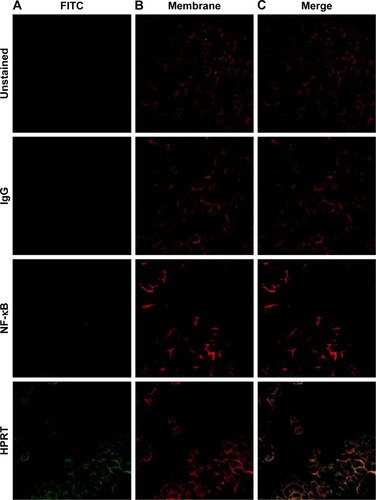
Figure 5 Scanning electron microscopy images and resulting EDAX in H460 cells.
Abbreviations: BSE, back scatter electron; EDAX, energy-dispersive analysis X-ray; GSE, gaseous side electron; HPRT, hypoxanthine guanine phosphoribosyltransferase.
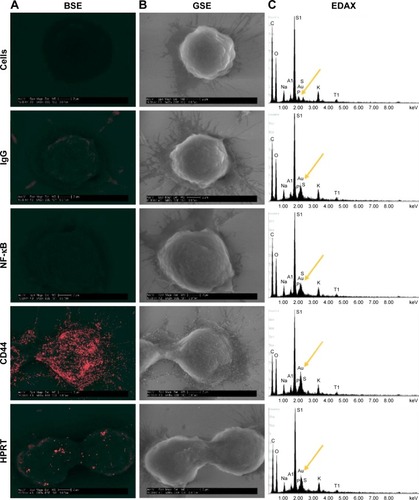
Figure 6 Gold percentage of H460 cells.
Abbreviation: HPRT, hypoxanthine guanine phosphoribosyltransferase.
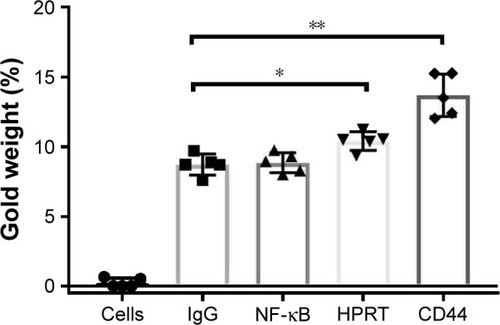
Figure 7 Evaluation of HPRT expression within patient tissue.
Abbreviation: HPRT, hypoxanthine guanine phosphoribosyltransferase.
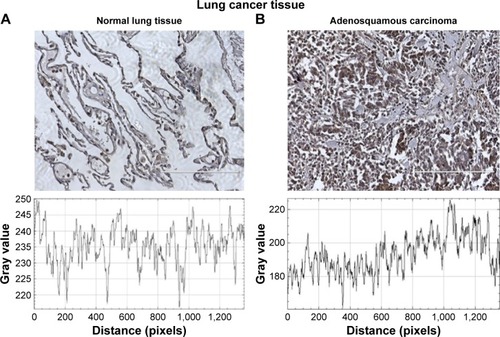
Figure 8 Statistical analysis of HPRT expression within patient tissue.
Abbreviation: HPRT, hypoxanthine guanine phosphoribosyltransferase.
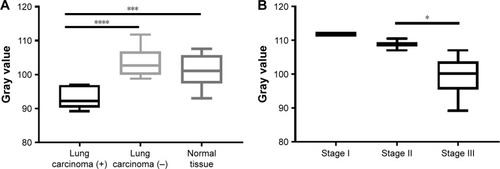
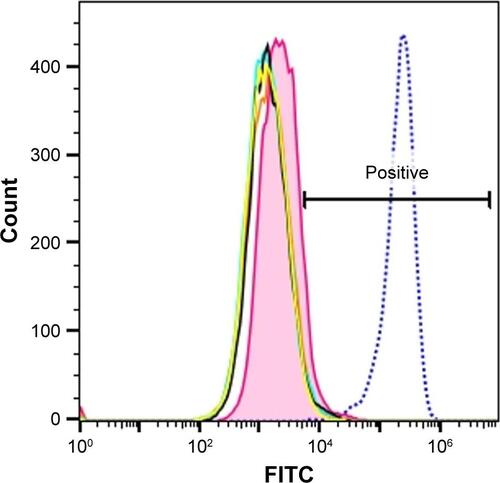
Figure S1 Salvage pathway expression on the surface of H460 cells.
Notes: CD44 is displayed in these diagrams in order to show a protein that is expressed on >99% of the cell population. (A) APRT surface expression is evaluated against a CD44 (blue) positive control and an NF-κB (aqua) negative control. (B) DCK (purple) surface expression in comparison with a CD44 (blue) positive control. (C) Anti-HPRT treated cells (pink) shift in the population in relation to CD44 (blue).
Abbreviations: APRT, adenine phosphoribosyltransferase; DCK, deoxycytidine kinase; HPRT, hypoxanthine guanine phosphoribosyltransferase.
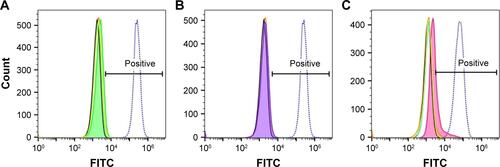
Figure S2 HPRT surface expression on A549 non-small-cell lung cancer cells.
Notes: When cells were exposed to anti-CD44 antibody (blue), ∼98% of the population was positive for surface expression. HPRT binding in A549 cells is compared to CD44 surface expression along with all controls.
Abbreviation: HPRT, hypoxanthine guanine phosphoribosyltransferase.