
Figures & data
Table 1 Characteristics of cancer patients (N=141)
Figure 1 Level of sCTLA-4 in all 4 groups.
Notes: Compared with the level of sCTLA-4 1 day before therapies, sCTLA-4 levels during therapies were significantly higher among all these 4 subgroups including the (A) RT, (B) chemotherapy, (C) CRT, and (D) whole patient group (all P<0.05).
Abbreviations: CRT, chemoradiotherapy; RT, radiotherapy; sCTLA-4, soluble cytotoxic T-lymphocyte antigen 4.
Abbreviations: CRT, chemoradiotherapy; RT, radiotherapy; sCTLA-4, soluble cytotoxic T-lymphocyte antigen 4.
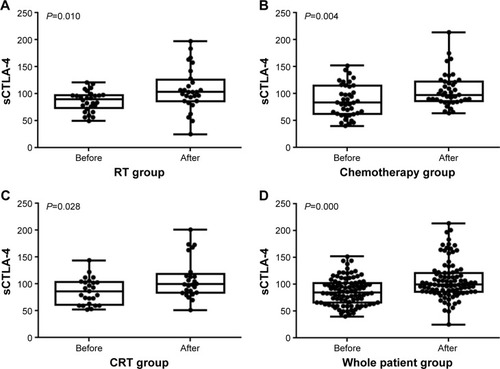
Figure 2 Survival curves for OS in all 4 groups.
Notes: Survival analysis was according to sCTLA-4 levels during therapy, with green indicating upregulated sCTLA-4 levels and blue denoting downregulated sCTLA-4 levels. Patients in the (A) RT, (B) chemotherapy, (C) CRT, and (D) whole patient groups with upregulated sCTLA-4 levels had longer OS than patients with downregulated sCTLA-4 levels (all P<0.05, log-rank test).
Abbreviations: CRT, chemoradiotherapy; OS, overall survival; RT, radiotherapy; sCTLA-4, soluble cytotoxic T-lymphocyte antigen 4.
Abbreviations: CRT, chemoradiotherapy; OS, overall survival; RT, radiotherapy; sCTLA-4, soluble cytotoxic T-lymphocyte antigen 4.
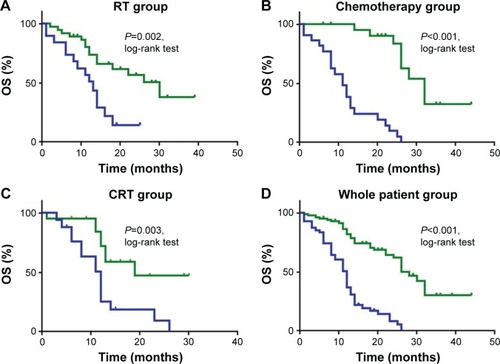
Figure 3 Survival curves for PFS in all 4 groups.
Notes: Survival analysis was according to sCTLA-4 levels during therapy, with green indicating upregulated sCTLA-4 levels and blue denoting downregulated sCTLA-4 levels. Patients in the (A) RT, (B) chemotherapy, (C) CRT, and (D) whole patient groups with upregulated sCTLA-4 levels had longer PFS than patients with downregulated sCTLA-4 levels (all P<0.05, log-rank test).
Abbreviations: CRT, chemoradiotherapy; PFS, progression-free survival; RT, radiotherapy; sCTLA-4, soluble cytotoxic T-lymphocyte antigen 4.
Abbreviations: CRT, chemoradiotherapy; PFS, progression-free survival; RT, radiotherapy; sCTLA-4, soluble cytotoxic T-lymphocyte antigen 4.
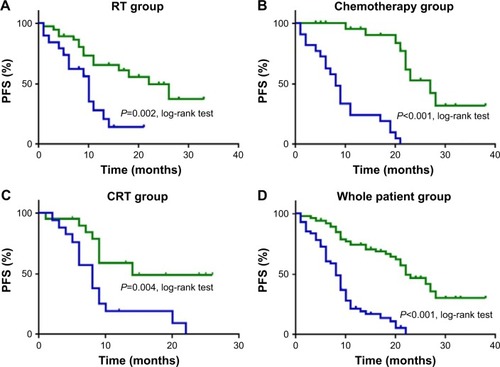
Table 2 Details of the Cox proportional hazard model for all 4 groups
Table 3 Spearman’s rho analyses for consistency between sCTLA-4 and clinicopathological factors