Figures & data
Figure 1 Study workflow showing the order of lncRNA analyses applied to develop a risk score model and use of the model to predict prognostic information and validate the efficiency of the signature panel.
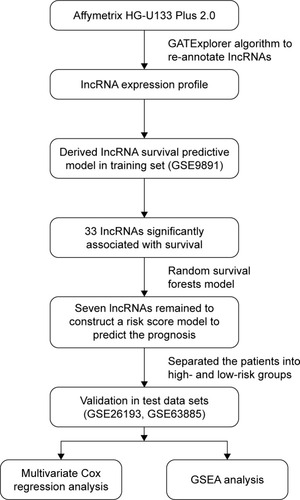
Figure 2 Random survival forests variable hunting analysis.
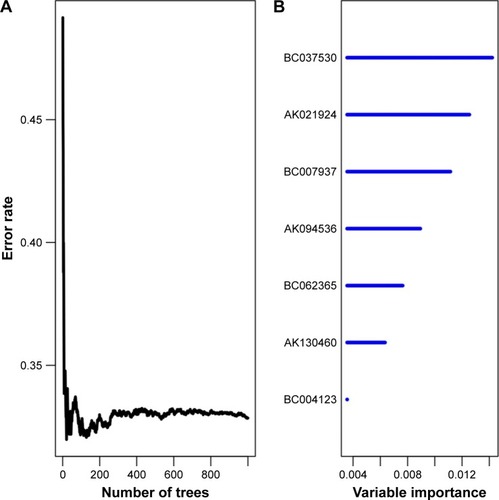
Table 1 Seven lncRNAs significantly associated with the overall survival in the training set (n=278)
Figure 3 Kaplan–Meier was used to estimate the survival of high-risk vs low-risk ovarian cancer patients based on the seven-lncRNA signature.
Abbreviations: OS, overall survival; PFS, progression-free survival; lncRNA, long noncoding RNA.
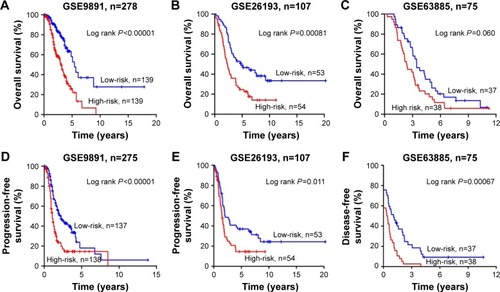
Figure 4 lncRNA risk score analysis of the GSE9891 patients.
Abbreviation: lncRNA, long noncoding RNA.
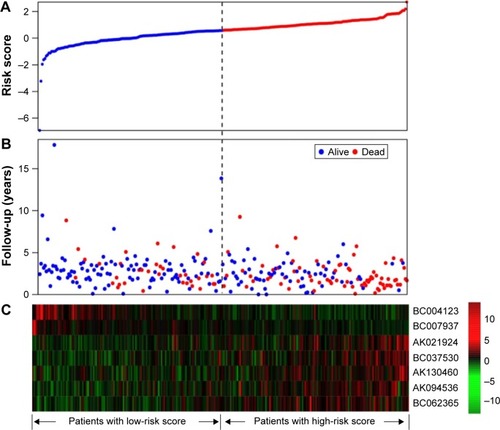
Table 2 Univariate and multivariate Cox regression analyses of OS in each data set
Table 3 Univariate and multivariate Cox regression analyses of PFS/DFSin each data set
Figure 5 ROC analysis of sensitivity and specificity for seven-lncRNA risk score, FIGO stage and patient age in training set.
Abbreviations: ROC, receiver operating characteristic; lncRNA, long noncoding RNA; AUROC, area under ROC; FIGO, Federation of Gynecology and Obstetrics.
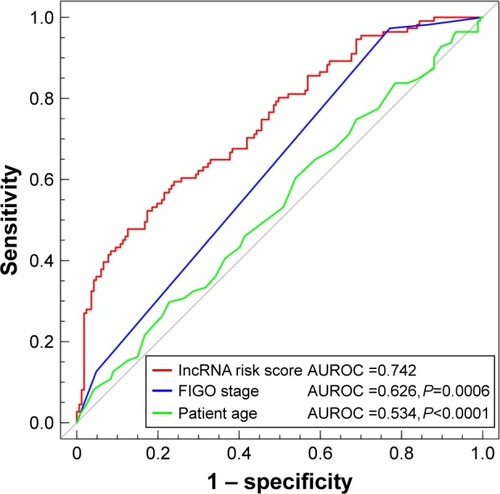
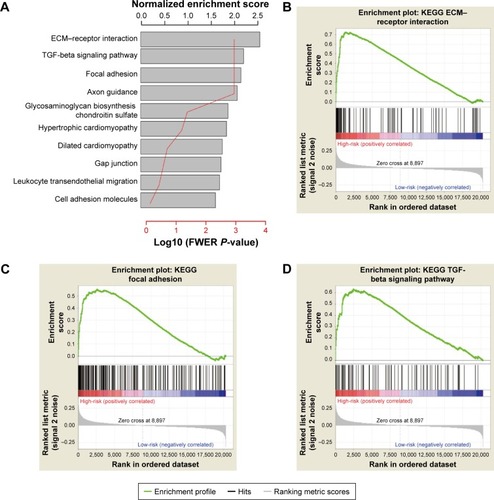
Figure 6 GSEA analysis of high-risk group.
Abbreviations: ECM, extracellular matrix; FWER, family-wise error rate; GSEA, Gene Set Enrichment Analysis; KEGG, Kyoto Encyclopedia of Genes and Genomes; TGF, transforming growth factor.